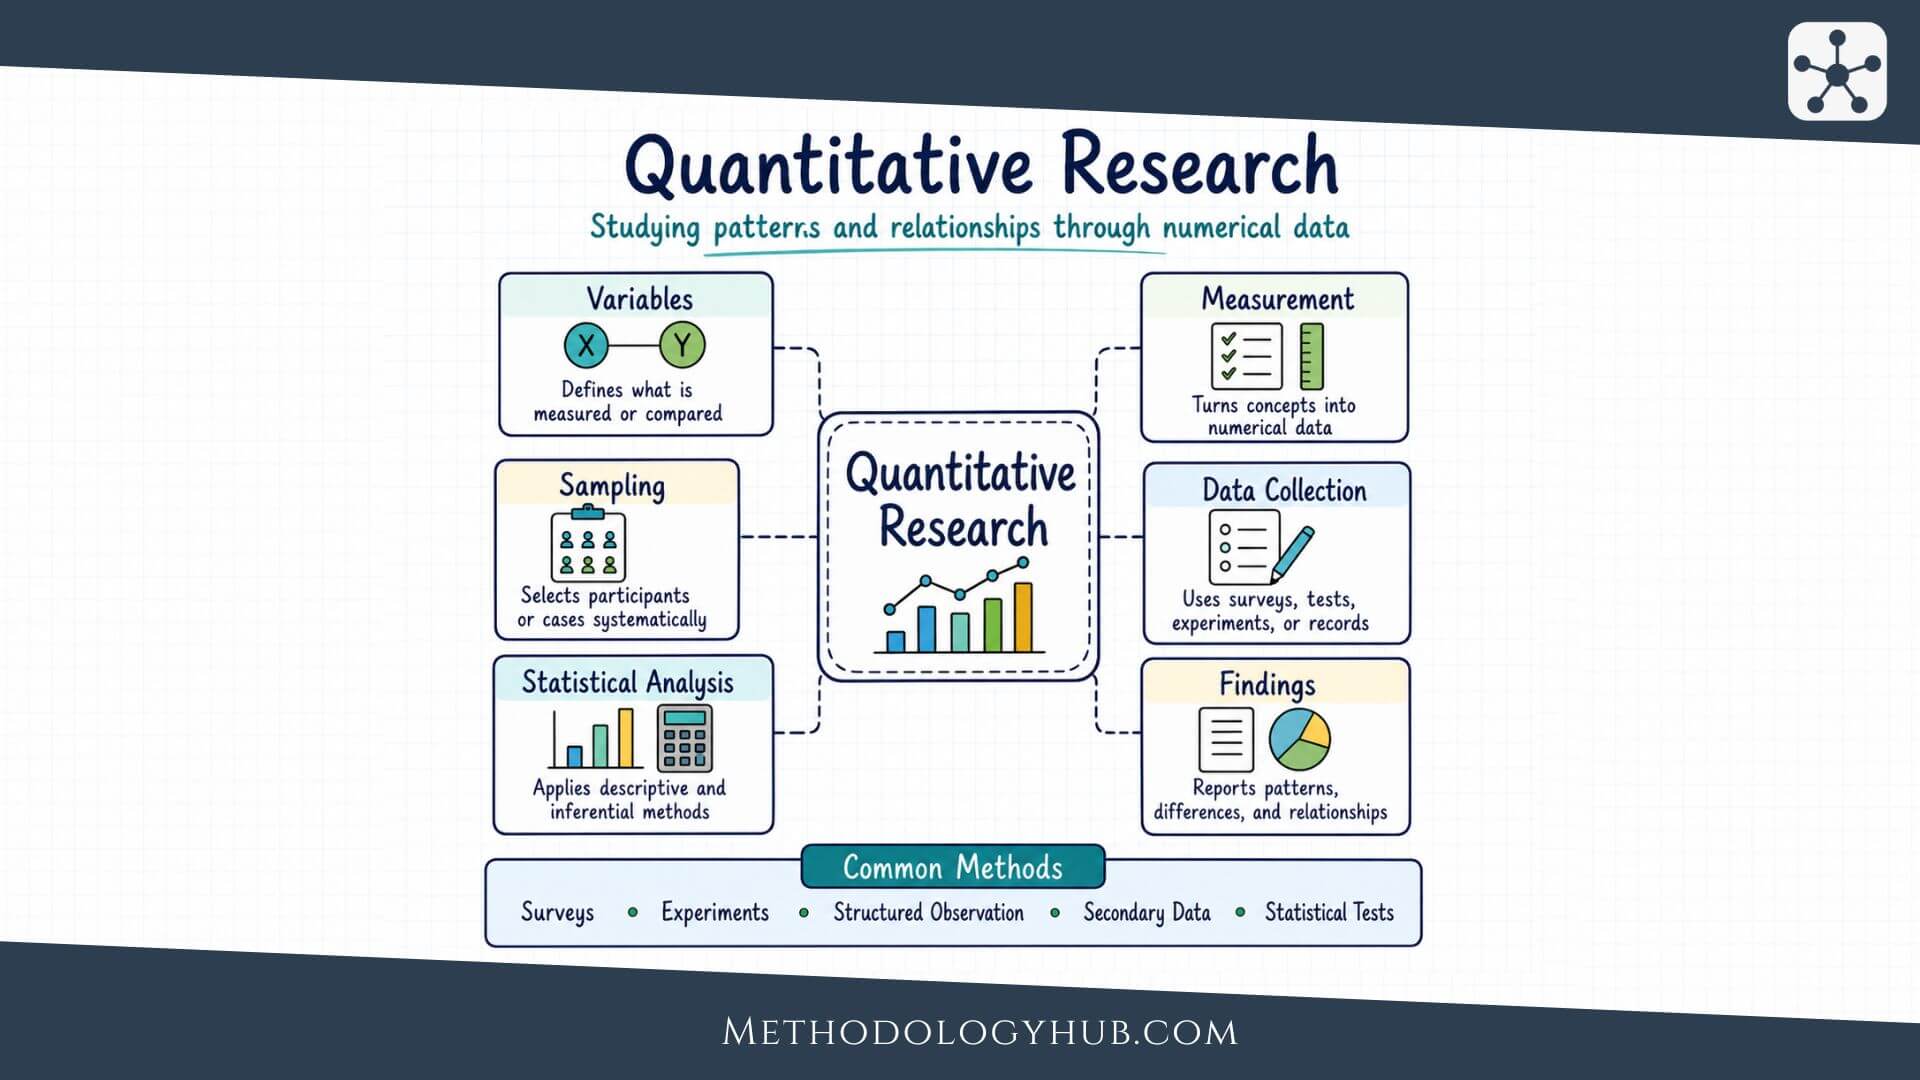
Quantitative research is a research methodology that uses numerical data to measure variables, compare groups, test relationships, estimate patterns, and examine hypotheses. It is used when a researcher wants to answer questions about amount, frequency, difference, association, prediction, or change with evidence that can be analysed statistically.
This article explains quantitative research and shows how quantitative studies are planned, what kinds of questions they answer, how they differ from qualitative research, which methods are commonly used, and how researchers can move from a research question to data collection, analysis, and interpretation without treating numbers as if they explain everything by themselves.
What Is Quantitative Research?
Quantitative research is an approach to research that collects and analyses numerical data. The numbers may come from test scores, survey scales, counts, measurements, administrative records, experiments, observations, or coded documents. The researcher then uses those numbers to describe a situation, compare groups, test a hypothesis, estimate a population value, or examine a relationship between variables.
The word quantitative does not mean that a study is automatically more precise, more objective, or more reliable than other approaches. It means that the study is built around measurement. A researcher decides what will be measured, how it will be measured, who or what will be included, and which statistical method can answer the question. If those decisions are weak, the numbers may look tidy while the conclusion remains fragile.
Quantitative research definition
Quantitative research is a research methodology that uses numerical data and statistical reasoning to study variables, patterns, differences, relationships, or effects. It is often used when the researcher wants to ask questions such as how many, how much, how often, how strong, how different, or how well one variable predicts another.
For example, a study may ask whether students who use a new revision schedule have higher average exam scores than students who use the usual schedule. Another study may ask how strongly sleep duration is associated with attention scores. A third may estimate the percentage of teachers who use a particular assessment method. These questions differ, but each depends on measurable data.

Where quantitative research fits in research design
Quantitative research is one methodology within the wider family of types of research. A single quantitative study can also be classified in other ways. It may be descriptive research if it records what exists, explanatory research if it studies why a pattern occurs, experimental research if the researcher manipulates a condition, or empirical research because it uses observed or collected evidence.
This overlap is normal. Quantitative research describes the kind of data and analysis used. Other labels describe the study’s purpose, objective, design, or timeframe. A survey that measures student workload at one point in time may be quantitative, descriptive, empirical, non-experimental, and cross-sectional. The labels work together rather than competing with one another.
What quantitative research can show
Quantitative research can show frequencies, averages, proportions, trends, differences between groups, associations between variables, and estimates of uncertainty. With a suitable design, it can also help test causal claims. A randomised experiment, for instance, can support a stronger causal interpretation than a one-time survey, because the researcher controls the condition being compared.
At the same time, the design sets limits. A cross-sectional research study can show that two variables are related at one point in time, but it usually cannot show which one came first. A correlational research study can measure association, but association is not the same as causation. The interpretation should stay within the design, not stretch beyond it.
Objectives of Quantitative Research
The objectives of quantitative research are connected by one common idea: the researcher wants to use measured evidence to make a careful statement about a question. Sometimes that statement is simple, such as the average number of hours students study each week. Sometimes it is comparative, such as whether two groups differ. Sometimes it is explanatory, such as whether an intervention is associated with a measurable change.
These objectives should be decided early in the research process. A study that aims to estimate a percentage needs a different design from a study that aims to test the effect of a teaching method. The objective shapes the sample, the variables, the instrument, and the statistical analysis.
Measuring variables
A central objective of quantitative research is measurement. The researcher turns concepts into variables that can be recorded in a consistent way. Age can be recorded in years. Attendance can be counted. Reading achievement can be measured with a test score. Attitude toward a course may be measured with a set of survey items.
This step is more important than it first appears. Concepts such as confidence, motivation, participation, stress, or academic progress are not measured automatically. The researcher has to decide which observable indicator will stand for the concept. That decision is called operationalisation, and it affects every later result.
Describing a population, group, or pattern
Quantitative research is often used for description. A researcher may describe average reading scores in a school, the proportion of students who have access to a quiet study space, the number of patient visits in a clinic, or the distribution of responses on a survey scale.
Description is not a weak objective. Many fields need accurate descriptive evidence before they can explain anything. If a university does not know how many first-year students work more than 20 hours per week, it is difficult to study how employment relates to attendance, grades, or wellbeing. Good description gives later explanation a firmer base.
Comparing groups or conditions
Another objective is comparison. Quantitative studies often compare two or more groups, conditions, time points, regions, schools, classrooms, or treatments. The comparison may be simple, such as the difference between two average scores, or more complex, such as a model that compares groups while accounting for prior achievement or age.
Comparison requires careful design. If two classes differ in exam scores, the difference may be connected to the teaching method, but it may also be connected to prior preparation, class size, attendance, or the difficulty of the assessment. Quantitative research does not remove these issues by itself. It gives the researcher tools to plan and examine comparisons more systematically.
Plain distinction: description asks what the data look like. Comparison asks whether two or more groups, conditions, or time points differ in a measured way.
Testing relationships between variables
Many quantitative studies examine relationships between variables. A researcher may ask whether study time is related to exam score, whether age is associated with technology use, or whether attendance predicts course completion. These studies usually work with correlations, regression models, or other statistical methods that describe the strength and direction of a relationship.
The wording of the conclusion should match the design. If the study only observes existing differences, it should usually speak about association, relationship, or prediction rather than cause. Stronger causal language needs stronger design features, such as random assignment, manipulation of a condition, comparison groups, repeated measurement, or a clear temporal order.
Testing hypotheses
Quantitative research is often connected to research hypotheses. A hypothesis turns a question into a testable claim. For example, a researcher may hypothesise that students who receive weekly feedback will have higher revision scores than students who receive feedback only at the end of a unit.
In this situation, the hypothesis guides the data collection and the analysis. The researcher needs a measurable outcome, a comparison structure, and a statistical procedure that fits the design. The result does not prove the hypothesis in an absolute sense. It shows how strongly the data support the claim under the design used.
Key Aspects of Quantitative Research
The key aspects of quantitative research are easiest to understand as a sequence. A researcher begins with a topic, turns it into a focused question, identifies variables, chooses a design, selects a sample, collects numerical data, analyses the data, and then interprets the findings in relation to the original question.
This sequence does not mean that every quantitative study is rigid. Researchers may revise instruments after pilot testing, adjust recruitment plans, or refine analysis decisions when they discover problems in the data. Still, the main logic should be visible. Readers should be able to follow how the study moved from the question to the conclusion.
Research question and variables
A quantitative study usually begins with a question that can be answered through measurement. Broad topics such as student learning, public health, classroom participation, or environmental change need to be narrowed. A focused research question tells the researcher what will be measured and how the variables relate to one another.
For example, the broad topic of sleep and learning can become a quantitative question such as: is average nightly sleep duration associated with working memory score among first-year students? This question names a population, two variables, and a relationship to examine. It is much easier to design than a general question about whether sleep affects learning.
Operational definitions
An operational definition explains how a variable will be measured in a study. The same concept can be measured in different ways. Attendance may mean total days present, percentage of sessions attended, or number of absences. Academic achievement may mean final grade, standardised test score, assignment average, or pass-fail status.
Clear operational definitions make the study easier to judge. Readers can see what the numbers represent and what they do not represent. If a study measures engagement only through login frequency, it should not later speak as if it measured attention, motivation, discussion quality, and effort at the same time.
Sampling and population
Quantitative research often aims to say something beyond the people or cases directly observed. This is why sampling needs attention. The population is the wider group the study is about. The sample is the smaller group from which data are collected. The sampling method affects how far the findings can reasonably travel.
A study based on a well-designed probability sample can support stronger population estimates than a study based only on volunteers from one class. That does not make volunteer samples useless. It means that the conclusion should be modest. The sample should match the claim the researcher wants to make.
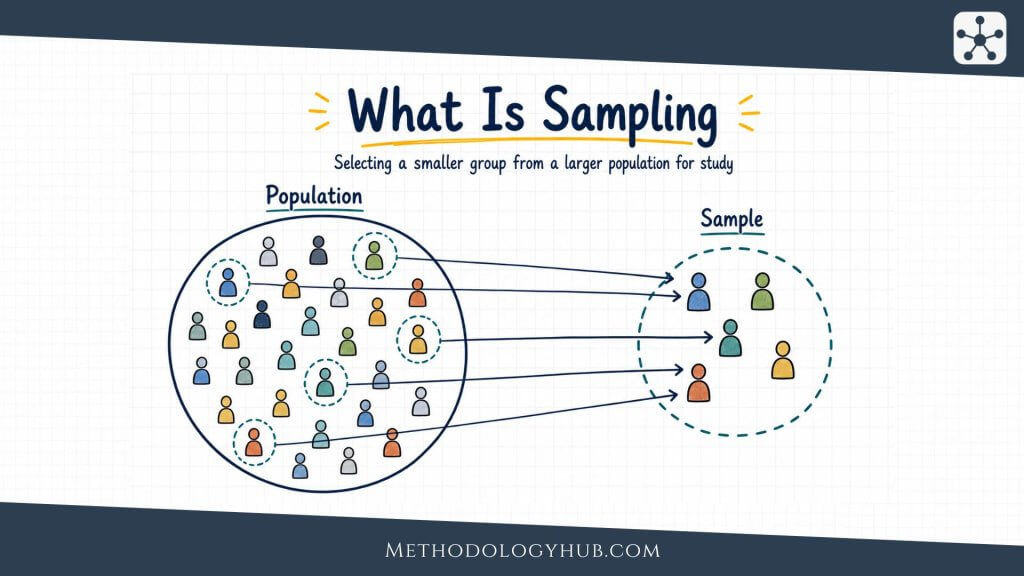
This is why sampling is not only a recruitment task. In quantitative research, it also shapes inference. If the researcher wants to estimate a value for a wider population, probability approaches such as random sampling, stratified sampling, cluster sampling, or systematic sampling may be appropriate when a usable sampling frame exists. These methods do not guarantee a perfect sample, but they give the selection process a clearer statistical basis.
Other studies use non-probability approaches because the population is difficult to list, the study is exploratory, or access is limited. A pilot survey may use convenience sampling to test an instrument quickly. A study of a specific subgroup may use purposive sampling to reach participants who fit defined criteria. Research on hard-to-reach groups may use snowball sampling. These choices can still produce useful quantitative data, but the report should be clear about who was reached and which population claims remain limited.
Measurement instruments
Quantitative data are often collected through structured instruments. These may include questionnaires, tests, rating scales, observation checklists, sensors, clinical measures, administrative records, or coding sheets. The instrument should match the variable and the participants.
Two questions are especially useful. First, does the instrument measure the concept it claims to measure? Second, does it measure it consistently enough for the analysis? These questions connect to validity and reliability. They are not decoration for a methods section. They shape whether the numerical result has meaning.
Statistical analysis
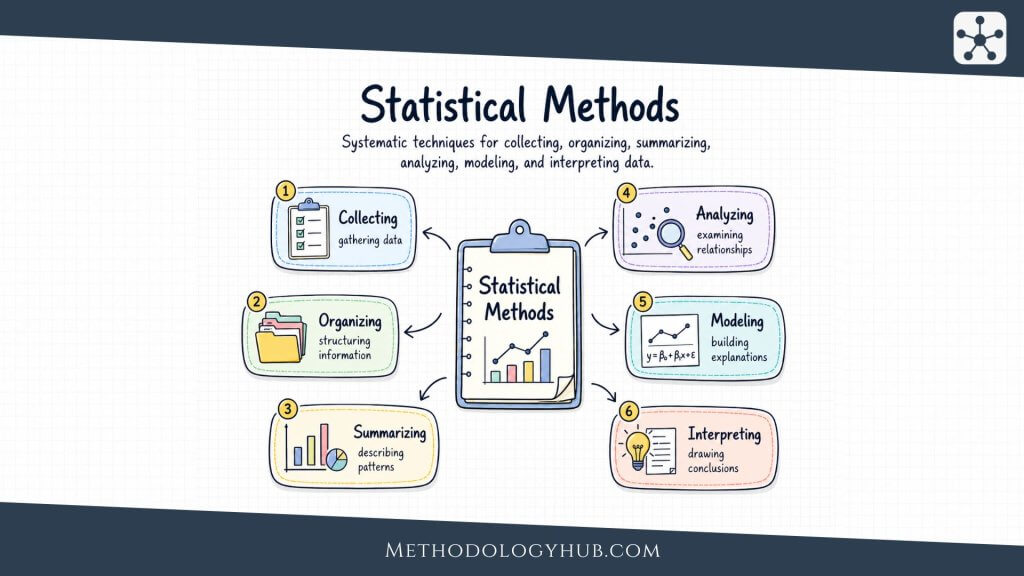
Statistical analysis is the process of organising, summarising, modelling, and interpreting numerical data. The analysis may begin with descriptive statistics, such as means, medians, percentages, ranges, and standard deviations. It may then use inferential procedures and other statistical methods, such as confidence intervals, hypothesis tests, correlation, regression, or analysis of variance.
The method should follow the question and the data structure. A question about two group means may need a t-test. A question about three or more group means may point toward ANOVA. A question about counts in categories may need a chi-square test. A question about association between two numerical variables may need correlation analysis or regression. The name of the method should not be chosen because it sounds advanced. It should fit the comparison or relationship being studied.
Test choice also depends on measurement level and assumptions. If two variables are numerical and the relationship is expected to be linear, the Pearson correlation coefficient may fit. If the data are ranked, ordinal, or better read as a monotonic pattern, Spearman’s rank correlation or Kendall’s tau may be more suitable. If two independent groups are compared with ranked or strongly skewed data, the Mann-Whitney U test may fit the question better than a mean-based test. The analysis should therefore be described as a reasoned choice, not as a software default.
In many reports, hypothesis testing and inferential statistics appear after descriptive summaries. That order helps readers see what was observed before they read the formal test. A table of means, percentages, or counts often makes the later p-value easier to understand because it shows the size and direction of the pattern being tested.
| Aspect | Question it answers | Example |
|---|---|---|
| Variable | What is being measured? | Attendance, score, age, response category |
| Sample | Who or what provides the data? | Students, schools, records, test items |
| Design | How is the study structured? | Survey, experiment, correlational study |
| Analysis | How are the data interpreted? | Percentages, t-test, correlation, regression |
Interpretation
Interpretation connects the statistical result back to the study. A p-value, mean difference, confidence interval, or regression coefficient is not the final answer by itself. The researcher still needs to explain what the result means in relation to the sample, the measurement, the design, and the original question.
A clear interpretation usually reports what was observed, how large the result was, how uncertain it is, and what kind of claim the design supports. In many quantitative reports, the problem is not the calculation. The problem is using stronger wording than the evidence can carry.
Quantitative vs Qualitative Research
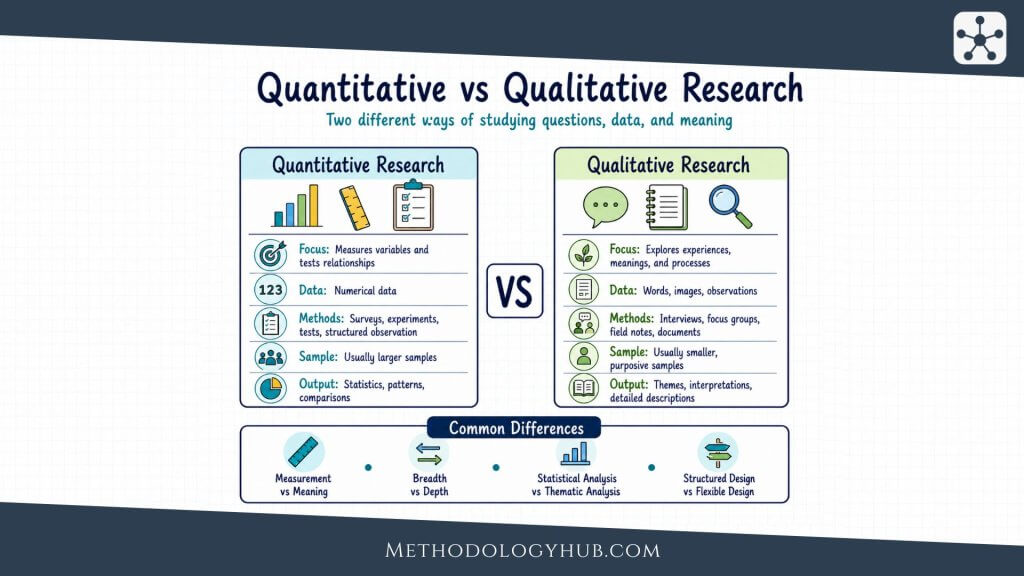
Quantitative research is often compared with qualitative research because the two approaches use different kinds of evidence. Quantitative research works mainly with numerical data and measurement. Qualitative research works mainly with meaning, experience, interaction, documents, practices, and context.
The difference is not that one approach is objective and the other is subjective. Both require judgement, careful design, and transparent analysis. The difference lies in the kind of question each approach is best prepared to answer. A quantitative study may show that participation increased after a new classroom routine was introduced. A qualitative study may show how students understood the routine, why some used it, and why others avoided it.
How the questions differ
Quantitative research is well suited to questions about amount, frequency, difference, association, and prediction. It can estimate how common something is, compare scores across groups, test whether a relationship appears in the data, or model how several variables relate to an outcome.
Qualitative research is often better suited to questions about meaning, process, interpretation, and context. It can show how people describe an experience, how a practice unfolds in a setting, or how documents construct a particular idea. These questions may later lead to quantitative variables, but they begin from a different kind of evidence.
How the data differ
Quantitative data are usually structured before or during data collection. Survey response options, test scores, checklist categories, and measurement units are defined in advance. This structure helps the researcher compare cases consistently and analyse the data statistically.
Qualitative data are often less standardised at the start. Interview transcripts, field notes, documents, and open responses may contain unexpected details. The analysis usually looks for patterns in language, action, meaning, or context rather than reducing every answer to a number immediately.
| Aspect | Quantitative research | Qualitative research |
|---|---|---|
| Main evidence | Numbers, scores, counts, measurements | Words, observations, documents, meanings |
| Typical questions | How many? How much? How strong? How different? | How do people understand, experience, or practise something? |
| Common analysis | Descriptive statistics, tests, models | Coding, themes, categories, narrative or document analysis |
| Typical output | Estimates, differences, associations, predictions | Themes, explanations of process, interpretations, case detail |
How quantitative and qualitative research can connect
The two approaches can support each other when the research question needs both measurement and context. A qualitative phase may help develop a survey by showing which response options make sense to participants. A quantitative phase may then test how common those patterns are in a larger sample.
This planned combination is called mixed methods research. The combination should be more than placing a quote beside a table. The researcher should explain how the two forms of evidence connect. One may explain the other, prepare the other, expand the other, or check whether both point toward the same interpretation.
Quantitative Research Methods
Quantitative research methods are the procedures used to collect numerical data. The method should fit the research question and the setting. A study that asks about population attitudes may use a structured survey. A study that tests an intervention may use an experiment. A study that examines existing patterns may analyse records, test scores, or coded observations.
Methods and designs are closely related, but they are not the same thing. A method is a way of collecting data. A design is the overall structure of the study. For example, a survey can be part of a cross-sectional design, a longitudinal design, a correlational design, or an evaluation study.
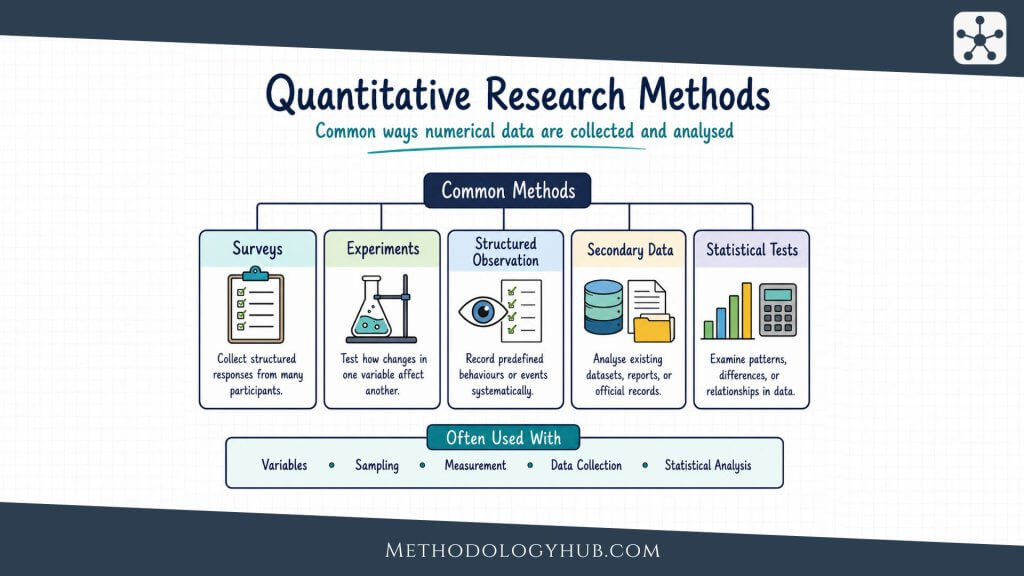
Surveys and questionnaires
Survey research is one of the most common forms of quantitative research. It uses structured questions to collect data from participants. Questions may ask about behaviours, attitudes, knowledge, background characteristics, or experiences. Responses are usually recorded as categories, ratings, frequencies, or numerical values.
Survey quality depends on more than sample size. The wording of questions, the order of items, the response options, the mode of delivery, and the response rate can all affect the results. A poorly written survey can produce neat tables from unclear questions. A strong survey makes the measurement logic visible before the analysis begins.
The sampling plan also changes what a survey can claim. A survey sent to a random sample of students from a complete enrolment list supports a different interpretation from a survey link shared with anyone willing to respond. Both may produce percentages, but those percentages do not travel equally far. In a strong quantitative report, the survey instrument and the recruitment route are described together because they jointly shape the dataset.
Experiments
Experimental research tests the effect of a condition or intervention by manipulating one variable and observing another. In a simple educational experiment, one group may receive a new practice activity while another group receives the usual activity. The researcher then compares outcomes such as scores, completion time, or error rates.
Random assignment is a major feature of strong experiments. It helps make the comparison groups similar before the intervention begins. This strengthens causal interpretation because differences observed after the intervention are less likely to be explained by pre-existing group differences.
Design note: An experiment changes a condition and observes the result. A non-experimental study observes variables without assigning participants to conditions.
Quasi-experimental studies
Quasi-experimental research examines an intervention or condition without full random assignment. This is common in schools, clinics, communities, and other real settings where random assignment may not be possible. A researcher may compare two existing classes, two clinics, or two time periods before and after a policy change.
The design can still be useful, but the interpretation needs care. Existing groups may differ before the intervention begins. Researchers often use pre-test measures, comparison groups, matching, statistical controls, or repeated observations to make the comparison more credible.
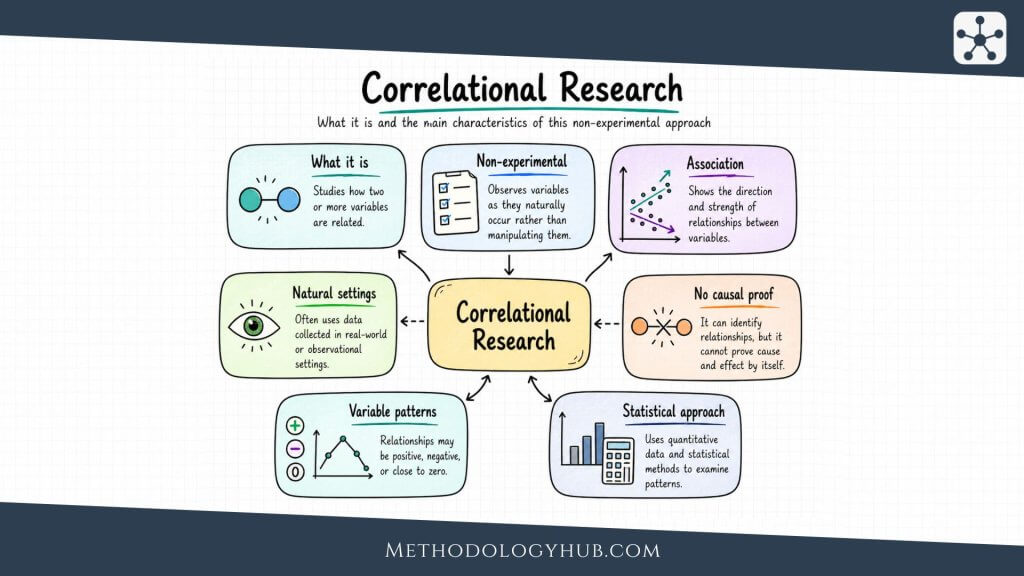
Correlational studies
Correlational studies examine whether variables are related. They do not require the researcher to manipulate a condition. A study may examine whether attendance is associated with course grade, whether stress scores are related to sleep duration, or whether reading frequency predicts vocabulary score.
Correlation is useful when the researcher wants to describe association or prediction. It should not be read automatically as evidence of cause. A relationship between two variables may be influenced by a third variable, by reverse order, or by the way both variables were measured.
In a correlational research design, the researcher should name the variables, the direction of the expected relationship if one is proposed, and the limits of the design. If the analysis uses formal correlation tests, the report should still include the observed coefficient and the context of measurement, not only whether the result was statistically significant.
Secondary data and records
Quantitative research can also use data that already exist. These may include school records, public datasets, clinical records, assessment archives, census data, environmental measurements, or institutional databases. Secondary data can make it possible to study large samples or long periods that would be difficult to collect from the beginning.
The main task is to understand how the data were originally produced. A record created for administration may not contain every variable a researcher would choose. Missing values, changed definitions, inconsistent coding, and limited context should be examined before analysis.
Structured observation and quantitative content analysis
Some quantitative studies turn observations, documents, or media into numerical data through coding. In structured observation, the researcher may count how often a behaviour occurs during a lesson. In quantitative content analysis, the researcher may code documents, articles, images, or messages into defined categories and then analyse the counts.
The coding rules are central. If two coders read the same text or observe the same session, they should be able to apply the rules in a similar way. This is why coding categories, examples, training, and agreement checks are often reported in quantitative content analysis.
Methodological Approaches in Quantitative Research
Methodological approaches in quantitative research describe the overall logic of the study. The same data collection method can serve different approaches. A questionnaire may be used to describe a group, test a relationship, compare groups, or follow change across time. The approach tells readers what the study is trying to do with the data.
Descriptive quantitative research
Descriptive quantitative research records characteristics, frequencies, averages, or distributions. It may report how many people selected each response option, what the average score was, or how a measured variable is spread across a group.
This approach is useful when the first task is to establish a clear picture of a situation. For example, a researcher may describe the percentage of students who have access to a laptop at home, the average waiting time in a clinic, or the distribution of scores on a placement test. The study may not explain every pattern, but it gives a measured account of what was found.
Comparative quantitative research
Comparative research examines differences between groups, cases, conditions, or time periods. The comparison might involve average scores, proportions, rates, or other numerical outcomes. The groups may be naturally occurring, such as different schools, or created by the researcher, as in an experiment.
Good comparative research explains why the comparison is meaningful. It also shows whether the groups are similar enough for the comparison to be interpreted. When groups differ in many ways before the study begins, the researcher should avoid presenting the difference as if only one explanation were possible.
Correlational and predictive approaches
Correlational and predictive approaches examine how variables move together. Correlation can describe the strength and direction of a relationship. Regression can estimate how one or more predictors relate to an outcome. These approaches are common when the researcher cannot or does not manipulate the variables.
For instance, a researcher may study whether attendance, prior grades, and study time predict final exam score. The model can show which variables are statistically associated with the outcome in the sample, and it may support prediction. It does not automatically show that changing one predictor will cause the outcome to change.
When regression is used, the researcher should explain the outcome variable, the predictors, and the purpose of the model. Some models are mainly explanatory, because they examine whether a predictor is associated with an outcome after accounting for other variables. Other models are mainly predictive, because they aim to estimate future or unseen outcomes as accurately as the data allow. Regression tests can help evaluate coefficients, but the interpretation still depends on sampling, measurement, model fit, and design.
Cross-sectional and longitudinal approaches
A cross-sectional quantitative study collects data at one point in time. It is useful for describing a current situation or examining relationships within a defined period. Many surveys are cross-sectional because they capture responses once.
Longitudinal research collects data across more than one time point. It can show change, sequence, and development more clearly than a one-time design. A researcher may follow students across a school year, measure patient outcomes before and after treatment, or track environmental readings across seasons.
Experimental and non-experimental approaches
Experimental approaches manipulate a condition and observe the outcome. Non-experimental approaches measure variables as they occur. Non-experimental research can still be quantitative, rigorous, and useful, especially when manipulation would be impossible or inappropriate for the question.
The distinction affects interpretation. Experimental designs can support stronger causal claims when they are well planned. Non-experimental designs are often better suited to description, association, prediction, or studying patterns in real settings. Both can produce strong work when the question, design, and claim are aligned.
How to Perform Quantitative Research
Performing quantitative research means turning a question into a design that can produce numerical evidence. The process is easier to follow when each decision is connected to the next. A vague topic becomes a research question. The question becomes variables. The variables become instruments and research data. The data become an analysis. The analysis becomes a carefully limited conclusion.
Step 1: Define the research topic and question
The first step is to choose a research topic and narrow it into a question that can be answered with data. A topic such as online learning is too broad. A quantitative question might ask whether weekly quiz completion predicts final course score among first-year students in an online course.
The question should name the main variables, the group or setting, and the kind of relationship or comparison being studied. This does not make the study less interesting. It makes the design possible.
Step 2: Identify variables and hypotheses
Next, the researcher identifies the variables. In a simple comparison, there may be a grouping variable and an outcome variable. In a correlational study, there may be two or more measured variables. In an experiment, there may be an independent variable that is manipulated and a dependent variable that is measured.
If the study tests a hypothesis, the hypothesis should be stated before the analysis. The hypothesis does not need to be complicated. It should say what difference, relationship, or direction the researcher expects to find, and it should be testable with the planned data.
Step 3: Choose the design and sample
The design should fit the question. A one-time survey may fit a descriptive question. A repeated-measures design may fit a question about change. An experiment may fit a question about the effect of an intervention. A correlational design may fit a question about association between variables.
The sampling plan should identify the population, the sample, the recruitment method, and the inclusion criteria. The researcher should also explain why the sample is suitable for the intended claim. A small convenience sample may be enough for a class project or pilot study, but it should not be described as if it represents a national population.
Sample size planning belongs in this step as well. A descriptive survey needs enough responses to estimate the target pattern with useful precision. A comparison study needs enough cases in each group for the planned analysis. A longitudinal study needs to expect some loss over time. The researcher does not have to turn every project into a large-scale study, but the sample size should make sense for the question, the design, and the analysis.
Step 4: Collect numerical data
Data collection should be consistent. Participants should receive the same instructions. Instruments should be used in the same way. Records should be extracted with the same rules. If observations are coded, coders should follow the same coding guide.
The researcher should keep track of missing data, incomplete responses, exclusions, and any changes to the planned procedure. These details may seem small during collection, but they become important when readers judge how the final dataset was formed.
Step 5: Prepare and analyse the data
Before analysis, the researcher checks the dataset. This may include identifying missing values, impossible values, duplicate entries, inconsistent coding, or outliers. The goal is not to make the data look perfect. It is to understand the data before drawing conclusions from them.
The analysis then follows the question. Descriptive statistics may be enough for a descriptive question. A hypothesis test may be used for a comparison. Correlation or regression may be used for relationships between variables. More complex designs may need models that account for repeated observations, clustering, or several predictors.
At this stage, it helps to separate descriptive summaries from formal statistical tests. Descriptive summaries tell the reader what the dataset contains. Tests and models ask whether the observed pattern is strong enough, under the assumptions of the method, to support a wider claim. Keeping those two tasks separate makes the final report easier to read.
Step 6: Interpret and report the findings
Reporting should connect numerical results to the research question. A useful report does not stop at saying that a result was statistically significant. It gives the direction, size, and uncertainty of the result, then explains what kind of claim the design supports.
For example, a report might state that students in the intervention group had a higher mean score than students in the comparison group, give the size of the difference, and explain whether the design supports a causal interpretation or only a cautious comparison. The final wording should help readers understand the evidence rather than overstate it.
Examples of Quantitative Research
Examples can make quantitative research easier to recognise. The examples below use academic, educational, public health, and social research situations rather than commercial examples. Each one shows how a broad interest can become a measurable question.
Example 1: Comparing teaching approaches
A researcher wants to know whether a new practice routine improves mathematics performance. Two classes complete the same pre-test and post-test. One class uses the new routine for six weeks, while another class continues with the usual practice schedule. The outcome is the change in test score.
This is quantitative research because the study measures performance numerically and compares groups. If the classes were not randomly assigned, the design may be quasi-experimental rather than fully experimental. The interpretation should mention that limitation rather than presenting the result as if every difference came only from the routine.
Example 2: Estimating access to study resources
A university surveys a sample of first-year students to estimate how many have regular access to a quiet study space, a laptop, and a stable internet connection. The survey uses closed response options so the results can be reported as percentages.
This is descriptive quantitative research. It does not need to test a complex theory to be useful. Its strength depends on the sampling plan, the clarity of the questions, and the honesty of the interpretation. If the sample comes only from one programme, the report should not describe the result as if it represents all students at the university.
Example 3: Studying a relationship between variables
A researcher studies whether sleep duration is associated with attention score among adolescents. Participants report average sleep duration for the past week and complete a standard attention task. The researcher uses correlation and regression to examine the relationship.
This is a correlational quantitative study. It can show whether the variables are related in the sample and whether the relationship remains after accounting for other measured variables. It should not automatically claim that sleep duration caused the attention score, especially if both variables were measured at the same time.
The statistical approach would depend on the form of the data. If both variables are approximately numerical and the relationship is linear, a Pearson correlation or linear regression may be suitable. If attention scores are ranked or the relationship is monotonic rather than linear, a rank-based correlation may give a clearer reading. The method follows the structure of the data, not only the topic.
Example 4: Tracking change over time
A public health researcher follows a group of patients across four appointments and records a symptom score at each appointment. The question is whether the average score changes over time and whether the pattern differs between age groups.
This is longitudinal quantitative research because the same participants are measured repeatedly. The analysis should account for the repeated structure of the data. Treating each appointment as if it came from a different person would ignore the way the observations are linked.
Example 5: Coding documents numerically
A researcher studies assessment guidelines from several schools and codes each document for the presence or absence of specific features, such as late-submission rules, feedback timelines, and resubmission options. The coded categories are then counted and compared across school types.
This is quantitative content analysis. The original material is text, but the analysis uses numerical coding. The study should report how the categories were defined, how disagreements were handled, and whether the coding was applied consistently.
Conclusion
Quantitative research gives researchers a structured way to study measured patterns. It can describe a group, compare conditions, examine relationships, test hypotheses, estimate population values, and track change over time. Its strength comes from the alignment between the research question, variables, sample, measurement instrument, design, and statistical analysis.
The approach is useful, but it is not automatic. Numbers need interpretation. A large dataset can still be weak if the variables are poorly defined. A statistically significant result can still be small, uncertain, or limited by the design. A clear quantitative study therefore explains not only what was calculated, but also how the evidence was produced and what kind of claim it can support.
The best starting point is the research question. Once the question is clear, the researcher can decide whether quantitative research is the right approach, which variables need measurement, which method fits the setting, and which statistical analysis can answer the question without stretching the evidence beyond its limits.
For students and early researchers, the most useful habit is to keep each part of the study connected. The question should lead to the variables. The variables should lead to the instrument. The sample should fit the population claim. The analysis should fit the design. When these links are visible, quantitative research becomes less about producing impressive numbers and more about building a clear route from evidence to conclusion.
FAQs on Quantitative Research
What is quantitative research?
Quantitative research is a research methodology that uses numerical data to measure variables, compare groups, test relationships, estimate patterns, or examine hypotheses. The data are usually analysed with statistical methods.
What is the main purpose of quantitative research?
The main purpose of quantitative research is to answer measurable questions about amount, frequency, difference, association, prediction, or change. It helps researchers use numerical evidence to describe patterns and test claims.
What are examples of quantitative research methods?
Examples of quantitative research methods include surveys, experiments, quasi-experiments, structured observations, analysis of existing records, correlational studies, and quantitative content analysis.
What is the difference between quantitative and qualitative research?
Quantitative research uses numerical data and statistical analysis. Qualitative research uses non-numerical evidence, such as interviews, observations, documents, or field notes, to study meaning, experience, context, and process.
Is survey research always quantitative?
Survey research is often quantitative when it uses closed questions, rating scales, counts, or numerical responses. It can also include qualitative elements if it collects open-ended answers that are analysed for meaning or themes.


