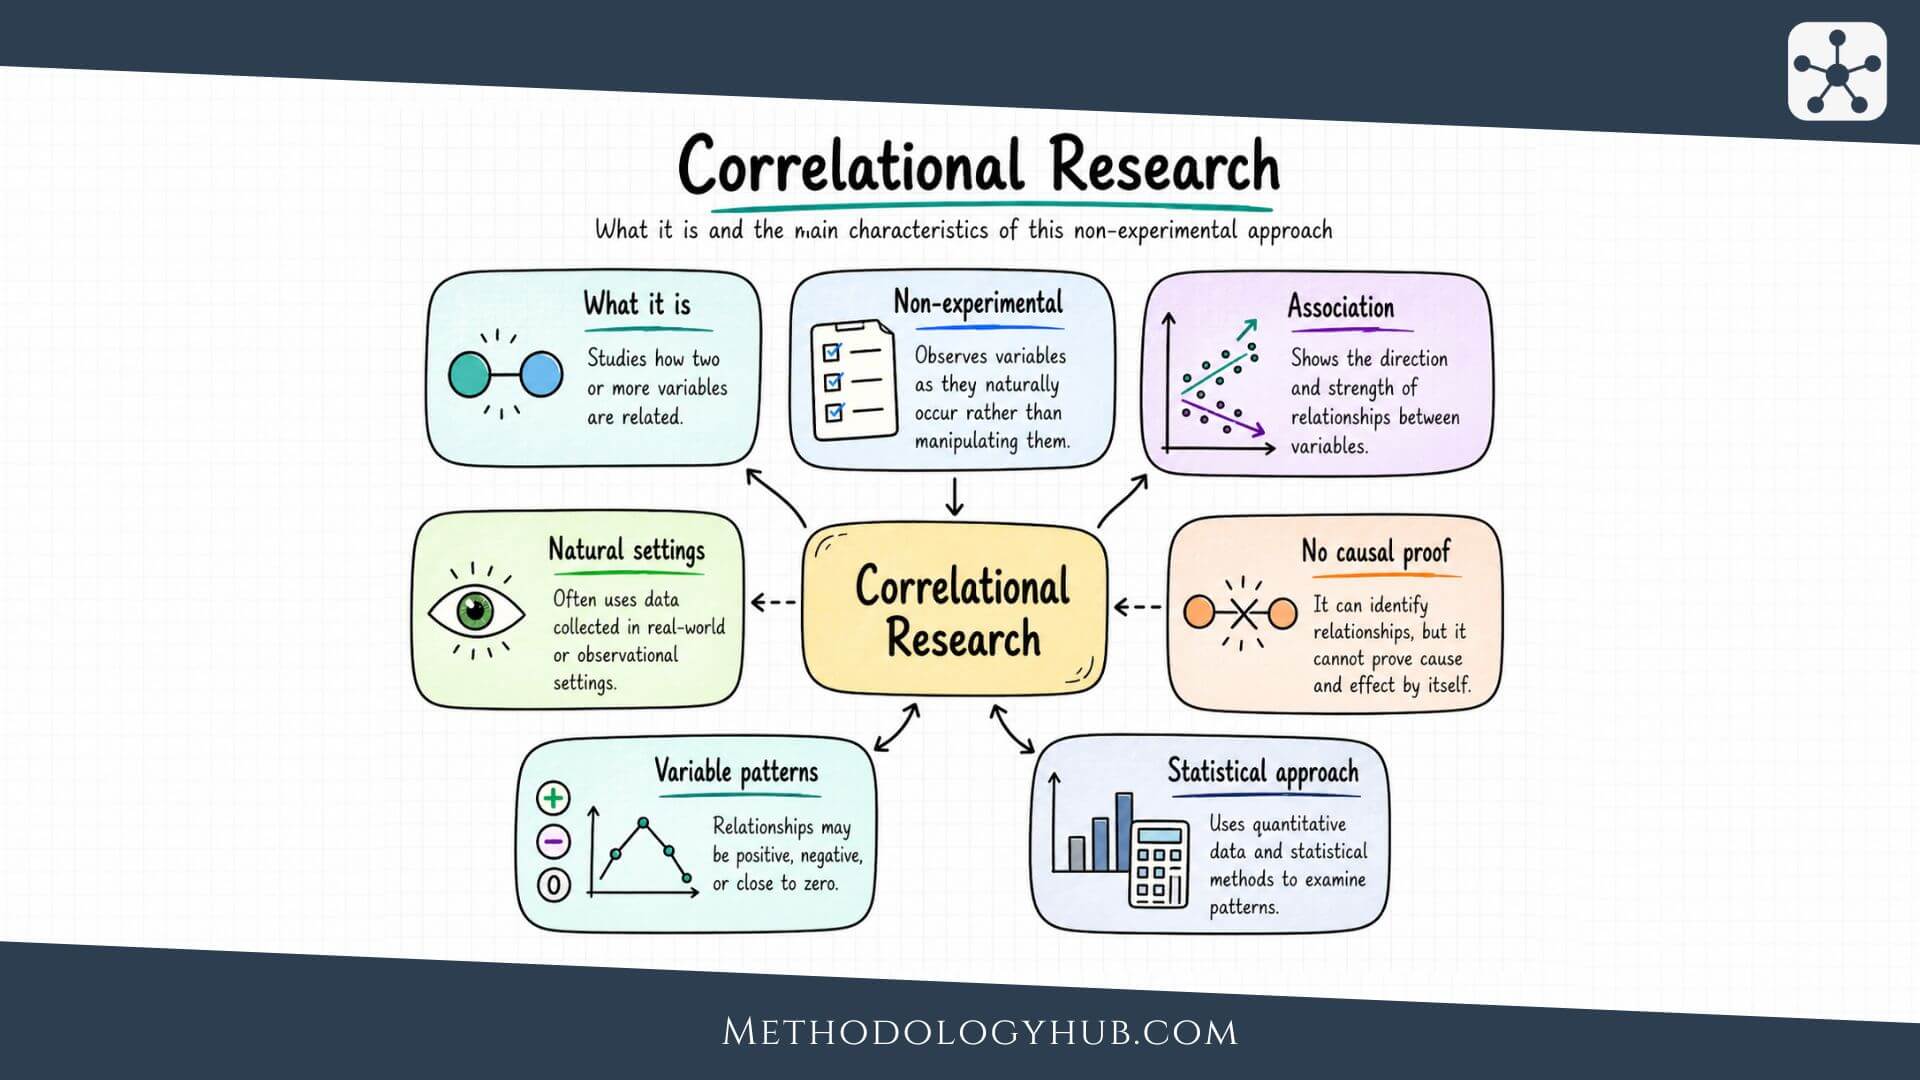
Correlational Research is a non-experimental research design used to examine how variables are related without manipulating them. Instead of assigning participants to conditions or changing the study setting, the researcher measures variables as they already occur and studies whether they move together in a consistent pattern.
This article explains what correlational research is, how it works, which designs and data collection methods are commonly used, and how researchers conduct a correlational study from the first research question to the final interpretation.
What is correlational research?
Correlational research is a type of research design that studies relationships between variables as they naturally exist. A researcher might measure sleep quality and attention scores, reading frequency and vocabulary size, social support and stress, or air pollution and respiratory symptoms. In each case, the question is whether the variables are associated, how strong that association is, and in what direction it goes.
The defining feature is that the researcher does not manipulate the variables. Participants are not assigned to a sleep condition, a reading condition, or a stress condition. Instead, the study records existing differences and examines how those differences are connected. That makes correlational research useful when manipulation would be impractical, artificial, or unsuitable for the research question.
How correlational research differs from experimental research
Experimental research changes something and then observes what happens. Correlational research measures what is already there. In an experiment, a researcher may randomly assign students to two teaching methods and compare later performance. In a correlational study, the researcher may measure the teaching methods students already experienced and then examine how those experiences are associated with later performance.
This difference affects interpretation. A well-designed experiment can support stronger causal claims because the researcher controls the intervention and often uses random assignment. A correlational study can show that variables are related, but it cannot by itself show that one caused the other. The relationship may be causal, reversed, shared by a third variable, or shaped by sampling methods and measurement conditions.
Even so, correlational research is not a weaker version of an experiment. It answers a different kind of question. Many research problems begin with association: Which variables tend to occur together? Which patterns are visible in real settings? Which relationships are strong enough to examine further? Correlational research gives those questions a clear structure.
Correlational research example
Suppose a researcher wants to study the relationship between academic self-efficacy and exam performance among first-year university students. The researcher asks students to complete a validated self-efficacy scale and then records their exam scores at the end of the term. If students with higher self-efficacy scores tend to receive higher exam scores, the study may find a positive association.
The result would still need careful wording. It would not prove that self-efficacy caused the exam scores. Students who already perform well may feel more confident. Prior preparation may influence both self-efficacy and performance. Course attendance, feedback, study time, and test anxiety may also be involved. The correlational study can describe the relationship and suggest directions for further analysis, but it should not jump beyond the design.
Characteristics of correlational research
Correlational research has a recognisable shape. It begins with variables that can be measured, a population or sample that can be observed, and a question about association. From there, the researcher chooses a design, collects or prepares data, and uses a statistical method that fits the measurement level and research question.
The design can be simple or quite advanced. A small cross-sectional survey with two variables may use a single correlation coefficient. A longitudinal study with several measurement waves may use cross-lagged correlations, regression models, or panel models. The shared feature is that the study examines relationships without direct manipulation.

Measured variables rather than manipulated variables
The first characteristic is measurement. Correlational research depends on observing values rather than creating conditions. These values may come from test scores, questionnaires, observations, health records, classroom documents, environmental readings, interview coding, or other forms of data.
This does not mean the researcher is passive. Good measurement still requires active decisions. The researcher must define each variable, choose reliable instruments, decide how missing values will be handled, and make sure the collected data can answer the question. A correlational study can only be as clear as the variables it measures.
Association instead of direct causal testing
The second characteristic is the focus on association. Correlational research asks whether variables are related, not whether a treatment produced an effect. That distinction should appear in the research question, the analysis, and the conclusion.
A careful correlational research question might ask, “How is perceived teacher support associated with student engagement in secondary school classrooms?” That question does not claim that teacher support causes engagement. It leaves room for the analysis to describe the pattern while keeping the interpretation within the design.
Direction and strength
Correlational research usually describes both direction and strength. Direction tells whether the relationship is positive or negative. Strength tells how closely the variables move together. Two variables may have a positive but weak relationship, a negative and strong relationship, or no clear relationship under the method used.
Direction and strength are helpful, but they are not enough on their own. A researcher also needs to look at the shape of the relationship, the sample size, the measurement scale, outliers, subgroups, and the wider research design. A neat coefficient can hide a messy pattern. A scatter plot, distribution check, and transparent description of the sample often make the interpretation more trustworthy.
Natural variation in real settings
Many correlational studies work with natural variation. Students differ in reading habits. Patients differ in symptom severity. Communities differ in exposure levels. Texts differ in linguistic features. Instead of forcing a treatment or condition, the researcher uses these differences to study relationships.
This can make correlational research especially useful for studying real-world patterns. It can examine variables that would be hard to assign deliberately, such as age, family background, prior experience, environmental exposure, or long-standing health conditions. It can also use data collected in ordinary settings rather than highly controlled laboratories.
Multiple data sources
Correlational research can use many kinds of data. Surveys are common, but they are only one option. Observation, structured coding, secondary datasets, text corpora, institutional records, diary entries, and repeated experience samples can all support correlational designs when the variables are defined clearly.
This flexibility is useful, but it also creates responsibility. Different data sources bring different forms of error. Survey responses may be affected by memory or social desirability. Observational data may be affected by coding choices. Archival data may have missing fields or inconsistent definitions. The researcher needs to understand the data source before treating the numbers as clean evidence.
Statistical interpretation in context
Correlational research is closely connected to Statistical Analysis, but the statistics do not interpret themselves. A coefficient, p-value, confidence interval, or regression estimate only becomes useful when it is read in relation to the research question, sample, measurement quality, and design.
That is why strong correlational writing tends to stay concrete. It names the variables, states the observed relationship, gives the statistical result, and then explains what the result can and cannot support. The interpretation should feel measured rather than dramatic.
Correlational research designs
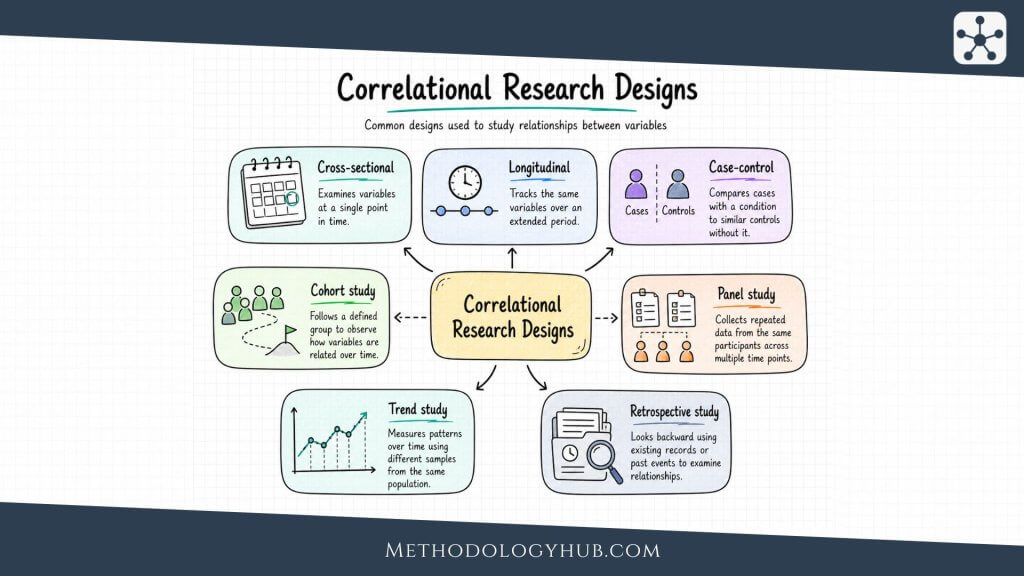
Correlational research is not a single fixed study design, but rather an analytical approach focused on examining relationships between variables. It can be applied across a range of different study designs, depending on how data are collected and structured. Cross-sectional, longitudinal, cohort, case-control, and panel studies can all be used within correlational research when the goal is to identify associations without manipulating variables. However, these designs are not inherently correlational by definition—they can also support descriptive, exploratory, or causal-inferential research depending on the research question and methodology.
Because of this flexibility, the same study design can serve different research purposes. For example, a cohort study may be used to explore correlations between early exposures and later outcomes, while in other contexts it may be designed to support stronger causal interpretations. Similarly, a cross-sectional study may be purely descriptive or used to test relationships between variables at a single point in time. What defines a correlational study is not the design itself, but the intention to analyse statistical associations between variables without experimental manipulation.
Cross-sectional design
A cross-sectional correlational design measures variables at one point in time. It is often used when the researcher wants a snapshot of how variables are related in a particular group. For example, a researcher may collect data on sleep quality, stress, and academic engagement from students during the same semester.
This design is efficient and relatively easy to administer. It can describe patterns across a sample and compare relationships among several variables. Its main limit is timing. Because all variables are measured at roughly the same time, it is usually difficult to say which variable came first.
Longitudinal design
A longitudinal correlational design measures variables across two or more time points. This design is useful when the researcher wants to study change, stability, or the order in which variables appear. For example, a study might measure social support at the start of the year, stress at mid-year, and well-being at the end of the year.
Longitudinal data can strengthen interpretation because timing becomes clearer. If one variable is measured before another, the study can examine whether earlier scores are associated with later scores. Still, longitudinal correlation is not automatic proof of cause. Other variables may still influence the pattern.
Case-control design
A case-control design begins with groups defined by an outcome or condition, then looks backward to compare earlier exposures or characteristics. In health research, cases may be participants with a condition, while controls are participants without it. The researcher then examines whether prior exposures differ between the groups.
Case-control studies are often useful when the outcome is rare or when following a large group over time would be difficult. In correlational form, the study examines whether prior variables are associated with group membership. The design can be efficient, but it depends heavily on accurate records, careful selection of controls, and clear definitions of exposure.
Cohort study
A cohort study begins with a group of participants who share a starting point, exposure, setting, or time frame, then follows them forward. The researcher measures predictor variables and later outcomes to examine how earlier differences are associated with later results.
For example, a cohort study may follow students entering university and examine whether first-semester belonging is associated with retention after one year. A health cohort may examine whether baseline activity level is associated with later symptom reports. Cohort designs can be powerful because they preserve a clearer time order than one-time surveys.
Panel study
A panel study follows the same individuals, households, classrooms, organisations, or other units across repeated waves. It is a specific form of longitudinal research. The strength of a panel design is that the researcher can examine both differences between participants and changes within the same participants over time.
For correlational research, panel data can be especially useful when the relationship may shift. A variable that is associated with an outcome at one wave may become weaker, stronger, or reversed later. Panel designs also support more advanced methods, including cross-lagged models and fixed-effects approaches, when the data and research question justify them.
Trend study
A trend study measures variables in the same population over time, but not necessarily in the same individuals. For example, a national survey may measure attitudes among different samples of young adults every two years. The researcher can then examine whether relationships among variables change across historical periods.
This design is useful when the population-level pattern is more relevant than individual change. It can show whether an association becomes more or less visible across time. Since different people may be sampled at each wave, the interpretation should focus on population trends rather than personal trajectories.
Retrospective study
A retrospective correlational study uses existing information about past events, exposures, or measurements. The researcher may work with medical records, school records, archived surveys, institutional datasets, or previously collected observational data. The analysis then examines relationships among variables that have already been recorded.
Retrospective designs can save time and allow researchers to study questions that would otherwise require long waiting periods. Their quality depends on the completeness and accuracy of the existing data. If a variable was not measured well at the time, the researcher cannot fully repair that weakness later.
Data collection methods for correlational research
Data collection in correlational research should follow the research question rather than the other way around. If the question is about observed behaviour, direct observation may fit. If the question is about attitudes, perceptions, or self-reported experiences, surveys may fit. If the question is about existing patterns across many records, archival research may be the better route.
Several data collection methods can support correlational research. They differ in what they capture, how much control the researcher has, and how close the data are to everyday behaviour.
Naturalistic observation
Naturalistic observation involves watching behaviour in its ordinary setting without changing the situation. A researcher may observe playground interaction, classroom participation, library use, clinic waiting-room behaviour, or public communication patterns. The goal is to record behaviour as it occurs rather than to create an artificial task.
This method can produce rich data, especially when the research question depends on context. It can also reduce some problems that come from asking people to remember or describe their own behaviour. At the same time, naturalistic observation usually gives the researcher less control. The behaviour of interest may not occur often, and observers need clear coding rules to avoid inconsistent interpretation.
Surveys
Surveys are one of the most common data collection methods in correlational research. They allow researchers to measure attitudes, beliefs, experiences, habits, symptoms, and self-reported behaviours across many participants. Survey data are often analysed through correlations, regression models, and group comparisons.
A survey works best when the variables are clearly defined and the questions are carefully written. Vague items create vague data. A survey about study habits, for example, should distinguish between time spent reading, time spent practising, time spent reviewing feedback, and time spent preparing for assessments if those distinctions are relevant to the research question.
Structured observation
Structured observation uses a predefined coding scheme to record behaviour. The setting may be natural, semi-natural, or arranged for the study, but the observation itself follows a systematic plan. Coders might record how often a participant initiates interaction, how long a behaviour lasts, or which categories of response appear in a session.
This method is useful when the researcher needs observable data rather than self-report. It also allows behaviour to be transformed into variables that can be analysed statistically. To support strong correlational research, the coding scheme should be precise, coders should be trained, and interrater agreement should be checked when more than one coder is involved.
Archival research and secondary data analysis
Archival research uses existing records rather than newly collected data. These records may include administrative files, medical records, school records, historical documents, census datasets, public repositories, or previous research data. When the data were collected by someone else, the approach is often called secondary data analysis.
This method can give researchers access to large samples and long time spans. It may also reduce the burden of collecting new data. The tradeoff is that the existing dataset may not contain exactly what the researcher would have measured. Definitions may be inconsistent, variables may be missing, and some records may have been created for administrative rather than research purposes.
Content analysis
Content analysis turns texts, images, recordings, or media materials into systematic data. A researcher might code themes in student reflections, count types of feedback comments, analyse policy documents, or classify features of interview transcripts. Once the material is coded, the researcher can examine relationships among content categories or between content variables and other measures.
Content analysis can be qualitative, quantitative, or mixed. In correlational research, the method is often used quantitatively after the coding scheme has created variables. For example, a study may examine whether the frequency of elaborated feedback comments is associated with later revision quality.
Experience sampling method
The experience sampling method collects repeated reports from participants during daily life. Participants may receive prompts at random or scheduled times and answer short questions about their current activity, mood, context, symptoms, or social situation. This creates data that are closer to lived experience than a single retrospective survey.
Experience sampling is useful when the researcher wants to study within-person variation. For example, the same participant may report stress, concentration, and social context several times a day. The analysis can then examine whether moments of higher stress are associated with lower concentration within the same person, between different people, or both.
Correlational research methods
Correlational research methods are the analytical tools used to examine relationships in the collected data. The best method depends on the number of variables, the measurement scale, the shape of the relationship, the timing of measurement, and the kind of interpretation the study needs.
Some methods are simple pairwise tools. Others model several variables at once. Some are designed for repeated measurements. Others handle sets of variables rather than single predictors and outcomes. The point is not to use the most complex method, but to choose the method whose assumptions and interpretation fit the research question.
Correlation analysis
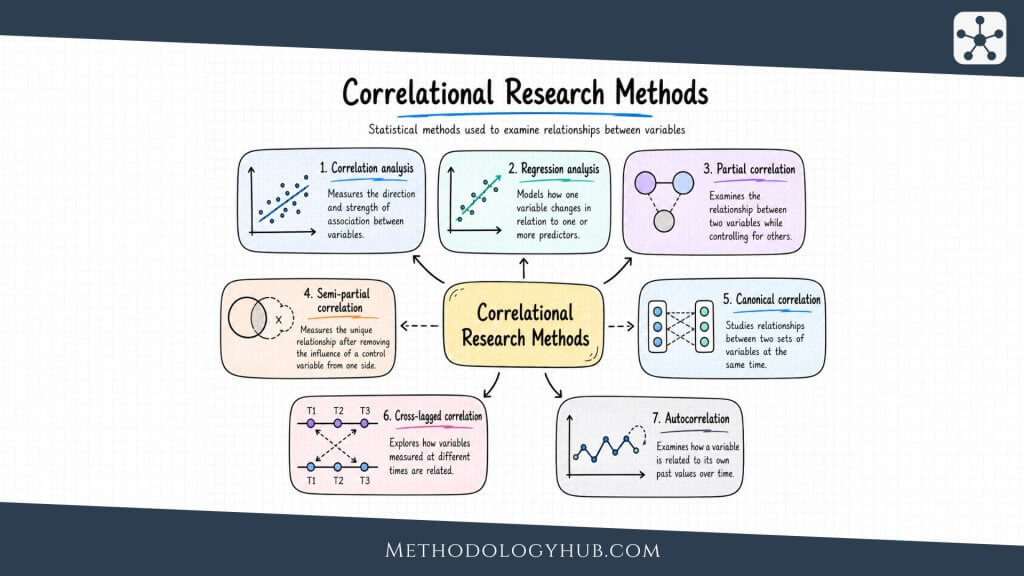
Correlation analysis measures the direction and strength of association between variables. The most familiar result is a correlation coefficient, often ranging from -1 to +1. Values closer to +1 indicate a stronger positive association, values closer to -1 indicate a stronger negative association, and values near 0 indicate little evidence of the type of relationship being measured.
The choice of coefficient depends on the data. Pearson correlation is usually used for roughly linear relationships between numerical variables. Spearman correlation is useful for ordinal data or monotonic relationships. Kendall’s tau is often useful for rank-based agreement or smaller samples. In all cases, the coefficient should be read with a plot and a clear statement of the variables.
Regression analysis
Regression analysis models how an outcome variable is associated with one or more predictor variables. In correlational research, regression is often used when the researcher wants to examine several predictors at once, adjust for covariates, or estimate the expected change in an outcome across values of a predictor.
For example, a researcher may examine whether study time is associated with exam performance while also accounting for prior achievement and attendance. This does not automatically make the study causal, but it can give a more refined description of the relationship than a single pairwise correlation.
Partial correlation
Partial correlation examines the association between two variables while controlling for one or more other variables. It asks whether two variables remain related after the shared association with a third variable has been removed statistically.
For example, reading time and vocabulary score may be related partly because both are associated with age. A partial correlation can estimate the relationship between reading time and vocabulary score after adjusting for age. The result is useful, but it still depends on measured variables. It cannot adjust for variables that were not included or not measured well.
Semi-partial correlation
Semi-partial correlation, also called part correlation, removes the influence of a control variable from one variable but not from both. It is often used to understand the unique contribution of a predictor in a regression context.
For example, a researcher may want to know how much additional variance in exam performance is associated with study planning after prior achievement has already been considered. A semi-partial correlation helps describe that unique association. It is especially useful when the researcher wants to compare predictors that overlap with one another.
Canonical correlation
Canonical correlation examines relationships between two sets of variables. Instead of asking whether one predictor is associated with one outcome, it asks whether a combination of variables in one set is related to a combination of variables in another set.
This method can be useful when the research question is naturally multivariate. For example, a study may examine whether a set of learning strategy variables is associated with a set of academic adjustment variables. Canonical correlation is more complex than ordinary correlation, so it needs adequate sample size, careful interpretation, and a clear reason for using sets rather than single variables.
Cross-lagged correlation
Cross-lagged correlation is used with longitudinal data. It examines whether one variable measured at an earlier time is associated with another variable measured later, often while also considering stability over time. This can help researchers study possible direction of association.
For example, a researcher may measure loneliness and sleep quality at two time points. Cross-lagged correlations can examine whether earlier loneliness is associated with later sleep quality and whether earlier sleep quality is associated with later loneliness. The design helps with time order, but it still requires careful interpretation because unmeasured variables may remain involved.
Autocorrelation
Autocorrelation examines whether a variable is correlated with itself across time. It is common in time-series data, repeated measures, and longitudinal records. If daily stress today is associated with daily stress tomorrow, that pattern is autocorrelation.
Autocorrelation is useful because repeated observations are often not independent. A participant’s score at one time point may be related to the same participant’s score at the next time point. Ignoring this can distort the analysis. In correlational research with repeated measurements, autocorrelation often needs to be described, modeled, or accounted for.
How to conduct correlational research
Conducting correlational research is not simply a matter of collecting two variables and calculating a coefficient. The study needs a focused question, carefully defined variables, a design that fits the question, data that can support the analysis, and an interpretation that stays within the limits of the design.
A good process also prevents the study from becoming a search for interesting numbers. Correlational research works best when the relationships being examined come from theory, prior research, practical observation, or a clearly stated exploratory purpose.
Step 1 – define the research question
Begin with a research question that names the variables and the population or context. A broad question such as “How are student factors related to achievement?” is too open for a single study. A clearer question would be: “How is academic self-efficacy associated with first-semester exam performance among first-year biology students?”
This version identifies the predictor-like variable, the outcome-like variable, and the group being studied. It also uses association language rather than causal language. That keeps the question aligned with the design from the start.
Step 2 – identify and define the variables
Each variable needs a conceptual definition and an operational definition. The conceptual definition explains what the variable means. The operational definition explains how it will be measured. “Stress” may refer to perceived stress, physiological stress, number of stressful life events, or daily stress intensity. Those are not interchangeable.
Clear variable definitions help the reader understand the result. They also help the researcher choose suitable instruments and avoid mixing variables that sound similar but measure different things.
Step 3 – choose the research design
The design should match the time structure of the question. If the question is about a current relationship, a cross-sectional design may fit. If it is about earlier and later variables, a longitudinal, cohort, panel, or retrospective design may be more suitable.
The design should also match what is feasible. A panel study may offer richer data than a one-time survey, but it requires follow-up, participant retention, and repeated measurement. A secondary dataset may be efficient, but only if the existing variables are suitable.
Step 4 – choose the data collection method
The data collection method should produce trustworthy values for the chosen variables. Surveys may fit perceptions or self-reported behaviour. Structured observation may fit visible actions. Archival records may fit attendance, grades, diagnoses, or long-term institutional data. Experience sampling may fit momentary states and daily variation.
This stage is also where researchers think about sampling and sampling methods. The sample should be connected to the population the study wants to describe. A narrow sample is not automatically a problem, but the report should not pretend it represents a broader population than it actually does.
Step 5 – prepare the data
Before analysis, the data need to be checked. This includes reviewing missing values, impossible values, duplicate records, coding consistency, variable distributions, and outliers. These checks are not cosmetic. They can change the interpretation of the relationship.
For example, a single impossible value in a small dataset can distort a Pearson correlation. A survey scale with many missing responses may no longer represent the intended construct. A coded observation variable may need reliability checks before it can be used confidently.
Step 6 – select the statistical method
The statistical method should follow the research question and the data structure. A Pearson correlation may fit two continuous variables with a roughly linear relationship. Spearman correlation may fit ordinal variables or monotonic relationships. Regression may fit a question involving an outcome and several predictors. Cross-lagged methods may fit repeated measurement across time.
Software can calculate many results quickly, but speed is not judgment. The researcher should know what the method assumes, what it estimates, and what kind of sentence can be written from the result.
Step 7 – interpret the findings carefully
Interpretation should name the relationship and its limits. A clear sentence might say: “Higher academic self-efficacy was associated with higher exam performance in this sample.” That is different from saying self-efficacy raised exam performance. The first sentence follows the design. The second sentence makes a stronger claim than the study can support on its own.
Good interpretation also connects the statistical result back to the research question. If the coefficient is small but precise, the result may still be relevant in context. If the coefficient is large but based on a small or biased sample, the interpretation should be more cautious. If the relationship changes after adjusting for another variable, that change should be reported rather than hidden.
Step 8 – report the study transparently
A correlational study report should explain the design, sample, variables, instruments, data collection procedure, analysis method, and interpretation. Readers should be able to see how the relationship was measured and why the chosen method was suitable.
When reporting results, include enough information to make the relationship understandable: coefficient, confidence interval when appropriate, sample size, p-value if used, and a description of the pattern. A scatter plot or table can also help readers see the relationship rather than relying on a single number.
Interpreting correlational research findings
Interpreting correlational research findings requires more than reading the size of a coefficient. The result has to be placed back into the design that produced it. A coefficient from a carefully sampled longitudinal study means something different from a coefficient from a small convenience survey. The number may look similar, but the support behind it is not the same.
A useful interpretation usually moves through three layers. First, describe the statistical relationship. Second, explain what that relationship means in the study context. Third, state the limits of the claim. This gives the reader enough information to understand the pattern without turning the result into something stronger than the study can support.
Read the coefficient with the data pattern
A correlation coefficient is a summary. It can be useful, but it is still a compression of many observations into one value. Before relying on that value, the researcher should examine the pattern behind it. A scatter plot may show a straight relationship, a curved relationship, two separate clusters, or one influential case that pulls the result.
This is especially relevant for Pearson correlation, which describes linear association. If the points form a curve, a Pearson coefficient may understate the relationship or describe it poorly. If the points split into subgroups, a single coefficient may blend several different patterns into one average summary.
Use field context rather than universal labels
Labels such as weak, moderate, and strong can help readers orient themselves, but they should not be treated as universal rules. A coefficient that looks modest in one field may be informative in another. In some social and behavioural research, small associations can still be useful when the outcome is complex and influenced by many variables. In a setting where two instruments are supposed to measure nearly the same thing, the same coefficient may be too low.
The interpretation should therefore ask what the relationship means for the variables being studied. Is the estimate precise? Is the sample suitable? Is the relationship stable across groups or time points? Does it fit the measurement scale? These questions make the interpretation more grounded than a label alone.
Keep causal language out of unsupported results
One of the simplest ways to report a correlational result clearly is to use association language. Phrases such as “was associated with,” “was related to,” “tended to co-occur with,” or “showed a positive relationship with” keep the sentence aligned with the design.
Causal language needs stronger support. A correlational result may contribute to a causal argument when combined with theory, time order, repeated findings, and designs that address alternative explanations. On its own, though, the result should be reported as a relationship. This is not a weakness in the writing. It is a sign that the interpretation matches the evidence.
Report uncertainty and sample information
A correlational result is an estimate, not a permanent property of the population. Another sample may produce a somewhat different value. This is why sample size, confidence intervals, and information about missing data are useful. They help the reader judge how stable the estimate is likely to be.
A report that only says “the variables were correlated” leaves too much hidden. A clearer report gives the coefficient, the sample size, the direction, the uncertainty when appropriate, and a short interpretation. If several correlations are examined, the researcher should also explain how those comparisons were selected and how the results should be read together.
Conclusion
Correlational research gives researchers a structured way to study relationships among variables when direct manipulation is not part of the design. It is used across education, psychology, health sciences, social sciences, communication, and other fields because many research questions begin with patterns of association.
The method is strongest when the study is planned carefully. A good correlational study defines its variables, chooses a suitable design, uses data collection methods that fit the question, checks the quality of the data, and selects an analysis method that matches the measurement scale and time structure. The writing should then explain what the relationship shows without claiming more than the design can support.
Correlational research is therefore both flexible and demanding. It can use cross-sectional surveys, longitudinal panels, cohort data, case-control comparisons, archival records, structured observations, content analysis, and experience sampling. It can also use simple or advanced statistical methods. What keeps the study coherent is the same central question: how are the variables related in the data available?
FAQs on correlational research
What is correlational research?
Correlational research is a non-experimental research design used to examine relationships between measured variables. It studies whether variables are associated, how strong the association is, and whether the direction is positive or negative.
What is the main purpose of correlational research?
The main purpose is to describe relationships among variables. A correlational study can show whether variables tend to move together, but it does not prove cause by itself.
What are the main types of correlational research designs?
Common designs include cross-sectional, longitudinal, case-control, cohort, panel, trend, and retrospective studies. They differ in how they organise measurement across time, groups, and existing records.
What data collection methods are used in correlational research?
Common methods include naturalistic observation, surveys, structured observation, archival research, secondary data analysis, content analysis, and the experience sampling method.
Can correlational research prove causation?
No. Correlational research can show that variables are related, but the relationship may have several explanations. Causal claims need stronger design evidence, such as manipulation, time order, control of alternative explanations, or other causal inference strategies.


