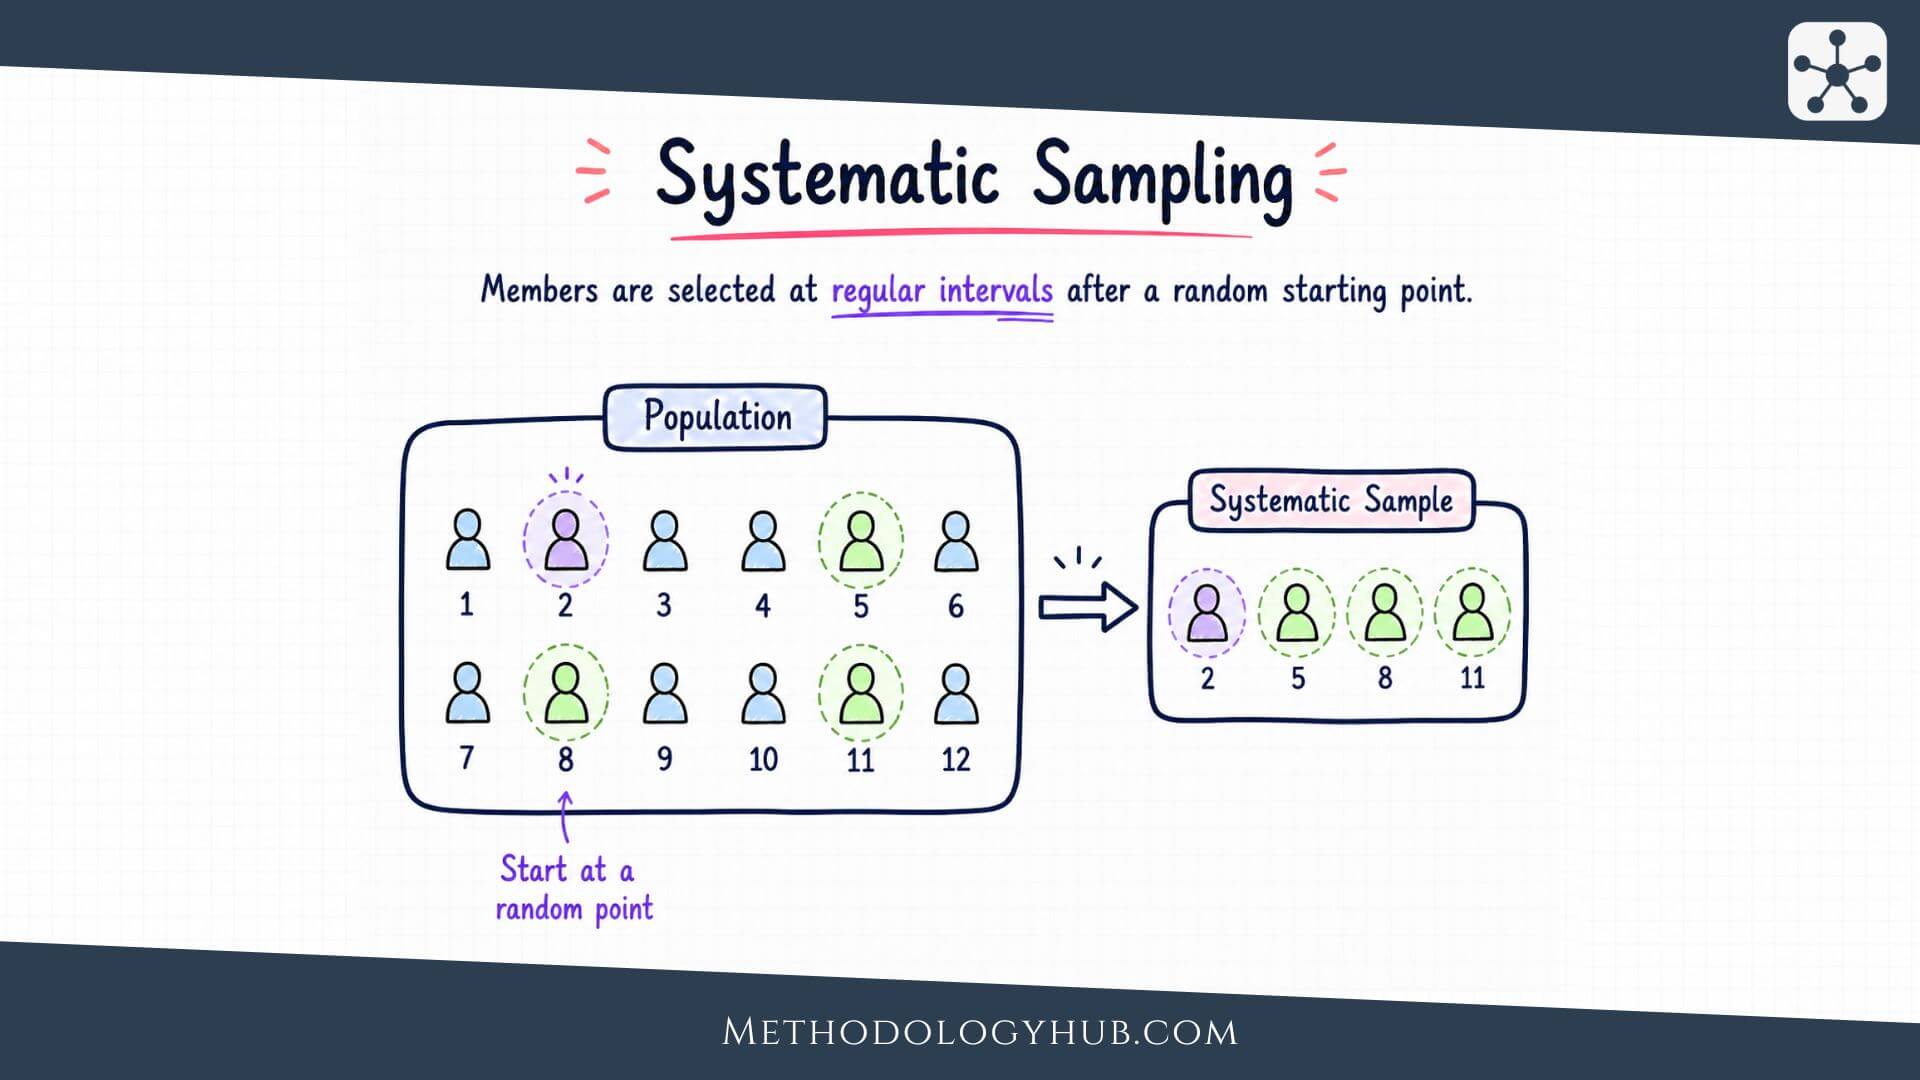
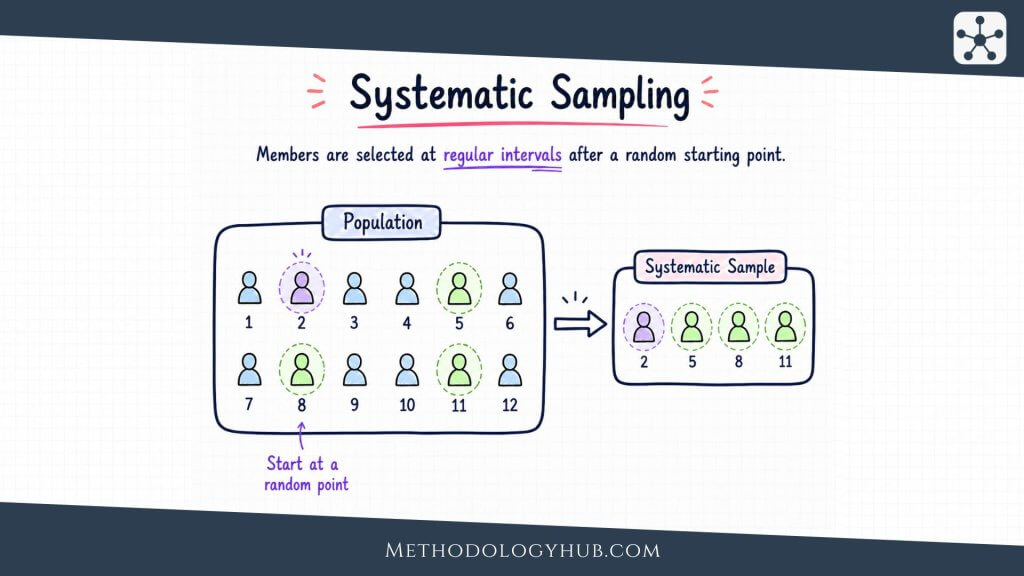
Systematic sampling is a probability-based sampling method in which researchers select units from an ordered list at regular intervals after choosing a random starting point. Instead of drawing every case separately, the researcher decides on a sampling interval and then follows that interval through the sampling frame.
The method is popular because it is easy to explain and usually simple to carry out. A researcher may have a list of students, patient records, classrooms, households, field plots, articles, or laboratory samples. If the list is suitable and the order does not hide a repeating pattern, systematic sampling can give a clear and efficient route from a population to a smaller sample.
This article explains what systematic sampling is, how the sampling interval works, when the method fits a study, how it compares with other sampling methods, how to use it step by step, and which advantages and limitations researchers should keep in mind when interpreting the final data.
What Is Systematic Sampling?
Systematic sampling is a probability sampling method that selects units from a sampling frame by using a fixed interval. The researcher first chooses a random starting point, then selects every kth unit from that point onward. The letter k is commonly used for the sampling interval.
For example, a researcher may have a list of 2,000 eligible students and need a sample of 200. The interval is 10 because 2,000 divided by 200 equals 10. The researcher chooses a random start between 1 and 10. If the random start is 6, the selected cases are the 6th, 16th, 26th, 36th, and so on until the sample is complete.
The regular spacing makes the method look different from simple random sampling. In simple random sampling, each selected unit is drawn through a random procedure. In systematic sampling, only the starting point is random in the usual version. After that, the interval controls the selection. This is why the list order becomes so important. A well-ordered or neutral list can make the method efficient. A list with a hidden repeating pattern can create a distorted sample.
Systematic sampling definition
Systematic sampling means selecting units from a defined population or sampling frame at regular intervals after a random start. It belongs to the probability sampling family when every eligible unit has a known chance of selection and the procedure is planned before selection begins.
The method is easiest to understand as a route through a list. The researcher does not ask which units look typical, convenient, or interesting. Once the start and interval are set, the rule decides which units enter the sample. That rule makes the process more transparent than informal recruitment and often easier to carry out than drawing many separate random numbers.
Population, sample, and sampling frame
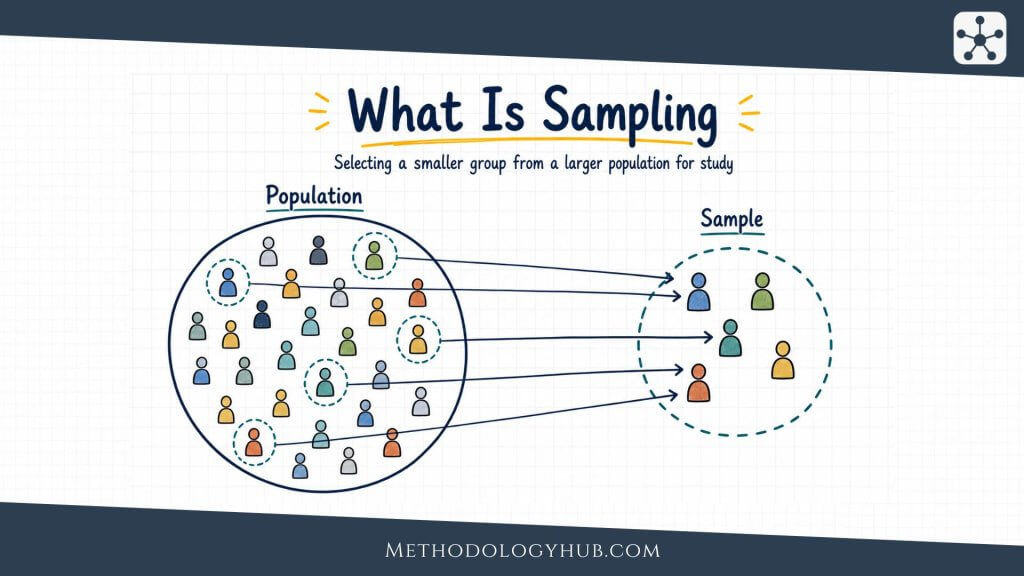
Systematic sampling begins with the same basic parts used in most sampling designs. The population is the full group the research question is about. The sample is the smaller set that will actually be studied. The sampling frame is the practical list, register, map, database, file sequence, or route from which the sample is selected.
In a school study, the population might be all pupils enrolled in a district during one academic year. The sampling frame might be the district enrolment list. In a records study, the population might be all eligible patient files from a defined period, while the frame is the ordered file list used by the hospital archive. In an environmental study, the population may be a mapped field or river section, and the frame may be a sequence of grid points or sampling locations.
The frame does not have to be perfect in a theoretical sense, but it has to be good enough for the study’s claim. If part of the population is missing from the frame, the interval cannot reach it. A careful researcher therefore checks the frame before thinking about the interval.
Systematic sampling and probability sampling
Systematic sampling is usually treated as a form of probability sampling because chance enters through the random start and each listed unit has a planned chance of selection. It is closely related to random sampling, but it is not the same as selecting every unit independently by chance.
This difference affects how the method should be used. If the list has no ordering related to the variables being studied, systematic sampling can behave much like a simple random sample in practice. If the list is ordered in a useful way, such as by geography or time, the method may spread the sample across the frame. If the list contains a repeating cycle that matches the interval, the sample can lean toward one type of unit.
Random start is the part that protects the rule
The random start is not a decorative step. It prevents the researcher from choosing the first case by preference. Without a random start, selecting every 10th case from the first entry could quietly favour units near particular positions in the list. A random start gives every position inside the first interval a fair opening chance.
After the start is chosen, the procedure becomes mechanical. That is one reason the method is useful in fieldwork and records research. Once the rule is written down, different people can apply it in the same way.
How Systematic Sampling Works
Systematic sampling works by turning a desired sample size into an interval. The researcher begins with a population or frame size, decides how many units are needed, and divides the frame size by the sample size. The result tells the researcher how far to move through the list between selected units.
This structure is easy to apply, but each part has to be handled carefully. The interval should come from the actual number of eligible units in the frame, not from a rough guess. The random start should be chosen before looking at which case it produces. The final sample should be checked against the planned rule, especially when the list contains ineligible entries, duplicates, or missing records.
The sampling interval
The sampling interval is the distance between selected units in the ordered frame. It is often written as k. If the population size is N and the desired sample size is n, the basic interval is calculated as N divided by n.
Sampling interval: k = N / n, where N is the number of units in the frame and n is the desired sample size.
If a university list contains 3,600 eligible students and the researcher needs 300 students, the interval is 12. A random start is chosen between 1 and 12. If the start is 4, the researcher selects the 4th, 16th, 28th, 40th, and later every 12th name until the sample is complete.
When N divides neatly by n, the interval is straightforward. Real frames do not always behave so neatly. A list may include 3,650 eligible units and the target sample may still be 300. Dividing 3,650 by 300 gives about 12.17. Researchers then need a clear rule, such as using an interval of 12 and stopping at the target sample size, using a circular systematic sample, or using software that handles the unequal spacing. The choice should be documented rather than hidden.
Random start
The random start is chosen from the first interval. If k is 12, the random start should be a number from 1 to 12. A random number generator, random number table, or statistical software can be used. The researcher should not choose a starting point because it seems neat or because it avoids difficult cases.
Once the start has been chosen, the interval does the rest. This makes the procedure easy to repeat and easy to audit. If another person follows the same frame, start, interval, and eligibility rules, they should reach the same selected list.
A simple systematic sampling example
Suppose a researcher wants to study library use among 1,200 students. The researcher has an eligible enrolment list and wants a sample of 120 students. The interval is 10. The researcher uses a random number generator and receives 7 as the starting point.
| Step | Action | Example |
|---|---|---|
| Define N | Count eligible units in the frame. | 1,200 students |
| Define n | Choose the desired sample size. | 120 students |
| Calculate k | Divide N by n. | 1,200 / 120 = 10 |
| Choose start | Pick a random number from 1 to k. | 7 |
| Select cases | Take every kth unit after the start. | 7, 17, 27, 37… |
The table makes the method look very simple, and in many projects it is. The work behind it is the preparation of the frame. If the list contains students who have left the university, duplicate entries, or students outside the study period, those entries should be handled before the interval is applied.
Linear and circular systematic sampling
In linear systematic sampling, the researcher starts within the first interval and moves forward through the list until the end is reached. If the sample is complete before the end, selection stops. This is the version usually taught first.
Circular systematic sampling treats the list as if the end connects back to the beginning. If the interval steps past the final unit, the selection continues from the top of the list until the required sample size is reached. This can be useful when the interval does not divide neatly into the frame size, but it also needs clear documentation so the reader understands how the list was handled.
Systematic sampling in physical settings
Not all frames are digital lists. A researcher may select every 5th file from an archive shelf, every 20th household along a mapped route, every 10th page in a document set, or every fixed grid point in a field. The same logic applies: define the frame, choose a start, apply the interval, and record the procedure.
Physical settings add practical decisions. If a selected household is empty, if a file is missing, or if a sampling point cannot be reached, the researcher should follow a planned replacement or non-response rule. Replacing unavailable units with the nearest convenient unit can damage the design, even when the interval itself was calculated correctly.
When to Use Systematic Sampling?
Systematic sampling is most suitable when the researcher has a clear, ordered frame and wants a simple probability-based selection process. It is especially useful when the frame is long, the desired sample is spread across the whole list, and the order of the list is not expected to repeat in a way that matches the interval.
The method often fits surveys, administrative records, school lists, clinical registers, inspection files, environmental grids, archival research, and other studies where cases can be arranged in a sequence. It is less suitable when the frame has a repeating structure that could line up with the interval or when the population cannot be listed or reached through a stable route.
Use it with long ordered lists
Systematic sampling is practical when a researcher has a long list and wants a sample spread across it. Drawing 500 separate random numbers from a list of 10,000 may be possible with software, but it can be tedious to apply by hand. Selecting a random start and then every 20th unit may be easier to carry out and easier to check.
This can be useful in records research. A researcher reviewing archived student support files may need a sample from several years of records. If the file order is neutral with respect to the study variables, a systematic sample can move through the archive in a consistent way.
Use it when the list order helps spread the sample
Sometimes the order of the frame is useful rather than harmful. A list ordered by geography may allow systematic sampling to spread observations across a region. A file sorted by date may spread selection across a period of time. A grid-based field sample may distribute measurement points across a site.
This spread is not the same as stratification, because the researcher is not sampling separately inside named subgroups. Still, systematic sampling can avoid the clumping that sometimes appears in a small simple random sample. Whether that is desirable depends on the research question and the structure of the frame.
Use it for routine selection rules
Because the procedure is simple, systematic sampling can be useful when several people will apply the same rule. Fieldworkers can be trained to choose a start and follow an interval. Archivists can pull every kth file. A lab team can select every kth stored sample after eligibility has been checked.
The simplicity does not remove the need for supervision. The team should still know what to do when selected units are missing, when eligibility is unclear, or when the frame changes during data collection. The method stays clean only when the rule is followed consistently.
Use another method when subgroup control is needed
If the research question needs planned subgroup representation, stratified sampling may be a better fit. Systematic sampling can spread cases across a list, but it does not guarantee enough cases in small categories unless the frame is ordered and the design is planned for that purpose.
For example, a study comparing first-year, second-year, and final-year students may need enough students in each year group. A systematic sample from one combined list may produce uneven counts. Stratifying by year first and then sampling within each year may give a more stable design.
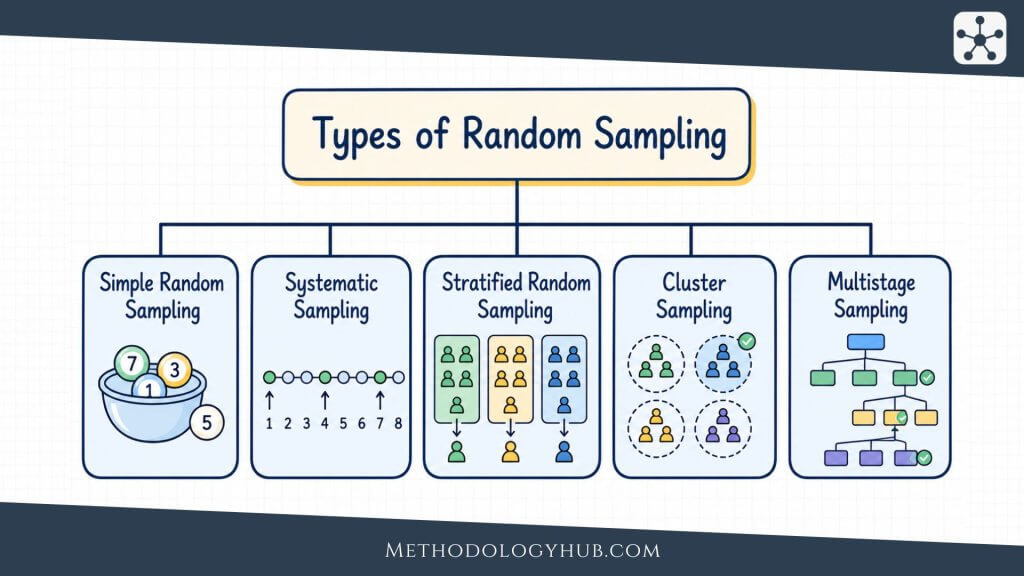
Systematic Sampling Compared With Other Sampling Methods
Systematic sampling sits between simplicity and structure. It is easier to apply than many probability designs, but it still needs a clear frame and a chance-based start. Comparing it with other methods helps show what the method can and cannot support.
The most useful comparison is with simple random sampling. Both can be probability methods. Both can support population estimates when the frame and response process are suitable. The difference lies in how the selected cases are chosen. Simple random sampling draws cases independently. Systematic sampling follows a fixed interval after the start.
Systematic sampling vs simple random sampling
In simple random sampling, every possible unit has an equal chance of being selected, and each selection is made through a random process. In systematic sampling, the first position is chosen randomly, and the remaining positions are determined by the interval.
Simple random sampling is often easier to justify statistically because each draw is random. Systematic sampling is often easier to carry out because the researcher does not need to generate a separate random number for every selected case. When the list order is harmless, both methods can produce useful samples. When the list contains cycles, systematic sampling needs more caution.
Systematic sampling vs stratified sampling
Stratified sampling divides the population into subgroups and then samples within each subgroup. It is useful when subgroup representation is part of the design. Systematic sampling does not automatically separate the population into strata, although it can be used within each stratum after the groups are defined.
For example, a researcher could divide a student list by faculty and then use systematic sampling inside each faculty. That would be a stratified systematic design. The stratification controls subgroup counts, while the systematic procedure selects units within each group.
Systematic sampling vs cluster sampling
Cluster sampling selects natural groups, such as schools, clinics, households, classrooms, or villages. It is useful when a population is spread across locations and a complete list of individuals is hard to build. Systematic sampling usually works from a list of units rather than selecting groups first.
The two methods can be combined. A researcher might randomly select schools, then use systematic sampling to select student records within each selected school. In that case, the analysis should reflect the clustered structure because students from the same school may resemble one another.
Systematic sampling vs non-probability sampling
Systematic sampling differs from convenience sampling, purposive sampling, and snowball sampling because it uses a planned selection rule based on a frame. Non-probability methods may be appropriate in qualitative, exploratory, or hard-to-reach settings, but they do not give every member of a wider population a known chance of selection.
This difference changes the claim. A systematic sample from a suitable frame can support estimates about that frame, with uncertainty described through suitable inferential statistics. A purposive interview sample can support rich analysis of selected cases, but it should not be written as if it estimates a population percentage.
| Method | How selection works | Good fit |
|---|---|---|
| Systematic sampling | Selects every kth unit after a random start. | Long ordered frames without harmful cycles. |
| Simple random sampling | Draws units by chance from a complete frame. | Clear listed populations with direct selection. |
| Stratified sampling | Samples within predefined subgroups. | Studies needing planned subgroup representation. |
| Cluster sampling | Selects natural groups first. | Spread-out populations with group structure. |
| Non-probability sampling | Selects cases without known selection probability. | Depth, access, rare cases, or exploratory work. |
Choosing between methods
The choice should follow the research question and the available frame. If the study needs a population estimate and the frame is long but usable, systematic sampling may be efficient. If subgroup comparisons are planned, stratified sampling may be stronger. If the population is spread across natural groups, cluster sampling may be more realistic. If the study needs people with a rare experience, a non-probability method may be more suitable.
There is no universal best sampling method. The stronger question is whether the method, frame, fieldwork, and planned statistical analysis fit together.
How to Use Systematic Sampling
Using systematic sampling well begins before the interval is calculated. The researcher needs to define the population, check the frame, decide the sample size, inspect the ordering, choose the random start, and document what happened during contact or data collection. The arithmetic is short. The design work around it is what makes the result interpretable.
The steps below describe a general process. A classroom project may use a short list and a small sample. A larger survey or records study may need software, response tracking, and a more detailed analysis plan. The same logic still applies.
Step 1: Define the target population
The target population is the group the study wants to make a statement about. It should be specific enough that a reader can tell who is included. “Students” is too broad for most studies. “Full-time undergraduate students enrolled at University X in the spring 2026 semester” is clearer.
The definition should follow the research question. If the study asks about school attendance among pupils in a district, the population may be pupils, schools, classes, or attendance records depending on the unit of analysis. This decision shapes the sampling frame and the later data collection plan.
Step 2: Identify the sampling frame
The sampling frame is the list or route used for selection. It may be an enrolment list, patient register, employee roster, library record list, address file, publication database, map, or file sequence. The frame should be checked for coverage, duplicates, outdated entries, and eligibility problems.
A frame can be orderly without being suitable. A list may be complete for administrative purposes but weak for the study. For example, a patient list may include records outside the study period, or a student list may exclude visiting students who belong in the target population. These problems should be fixed or reported before selection begins.
Step 3: Decide the sample size
The sample size depends on the research question, population size, expected variation, available resources, and planned analysis. A study estimating a proportion with a narrow confidence interval may need a larger sample than a small descriptive class project. A study comparing groups may need enough cases in each group rather than enough cases overall.
Sample size planning should happen before the interval is chosen. If the researcher changes the desired sample size after seeing which cases are selected, the method becomes less transparent. The sampling plan should state the intended sample size and, when needed, the reason for it.
Step 4: Calculate the sampling interval
Once the eligible frame size and target sample size are known, the interval can be calculated. Divide the frame size by the desired sample size. If the result is a whole number, the interval is easy to apply. If it is not a whole number, choose and document a rule for rounding, stopping, or using a circular procedure.
For example, if 2,400 eligible records are available and 300 are needed, the interval is 8. If 2,450 records are available and 300 are needed, the interval is about 8.17. The researcher might use every 8th record and stop when 300 have been selected, or use software to apply a systematic rule that reaches the desired size. The important point for the reader is that the rule is stated clearly.
Step 5: Choose a random start
The random start should be chosen from the first interval. If k is 8, choose a random number from 1 to 8. This can be done with a random number generator, a spreadsheet, statistical software, or a printed random number table.
After the start is selected, the researcher adds the interval repeatedly. If the start is 5 and the interval is 8, the selected positions are 5, 13, 21, 29, and so on. The selected units should be recorded by their frame position or identifier so the process can be checked later.
Step 6: Select the units and handle eligibility
After positions are selected, the researcher should check whether each selected unit is eligible and reachable according to the study plan. This is where many real studies become less tidy than examples. A file may be missing. A record may be outside the date range. A selected participant may decline. A household may not be contactable.
The response should follow a written rule. Some studies keep the selected unit in the denominator and report non-response. Others draw a replacement sample using the same sampling design. Replacing selected units with nearby or convenient cases should be avoided unless the design explicitly allows it.
Step 7: Document the procedure
A strong methods section should make the sampling path visible. The reader should see the population, frame, frame size, target sample size, interval, random start, final selected number, response rate if relevant, and any exclusions or replacements.
Example reporting sentence: From a list of 2,400 eligible records, we selected a systematic sample of 300 records using an interval of 8 after a random start of 5.
That sentence may need more detail in a full research report, but it gives the reader the essential route. If non-response, exclusions, or replacement rules were used, those details should follow. The goal is not to make the method sound more complex. The goal is to make it traceable.
Step 8: Analyse the data in line with the design
For many basic analyses, a systematic sample from a suitable frame can be treated similarly to a simple random sample, especially when the list order is not related to the outcome. Still, the researcher should think about the design before choosing standard errors, confidence intervals, or tests.
If the sample was drawn within strata, across clusters, or with unequal probabilities, the analysis may need weights or design-aware methods. If the study later uses hypothesis testing, correlation analysis, or regression analysis, the sampling plan should be described before the results are interpreted.
Advantages of Systematic Sampling
Systematic sampling has several advantages when the frame is suitable and the research goal calls for probability-based selection. Its strengths come from the combination of a random start and a simple interval. The method can be easier to apply than simple random sampling while still giving the study a clear selection rule.
These advantages are strongest when the list order has been checked. A neat interval cannot rescue a weak frame or a hidden cycle. When the frame is sound, however, the method can make sampling efficient and transparent.
It is simple to carry out
Once the interval and start are known, systematic sampling is straightforward. Fieldworkers, students, archive staff, or research assistants can follow the same rule without generating a new random number for each selected case. This can reduce clerical work and make the procedure less prone to accidental choice.
The simplicity is also useful in teaching. Students can see how the sample is formed and why the random start is needed. The method turns an abstract idea – probability-based selection – into a concrete sequence of selected positions.
It spreads the sample across the frame
Because selection happens at regular intervals, the sample is spread across the full list. If the list is ordered by date, location, or another meaningful sequence, this spread can be useful. It can prevent the sample from clustering in one part of the frame.
For example, if patient records are ordered across a full year and the interval is applied throughout the list, the sample may include records from across the year rather than from one short period. This does not replace careful design, but it can support a balanced selection across the frame.
It is easy to report
A systematic sampling procedure can usually be described in a few clear sentences. Readers can see the frame size, sample size, interval, random start, and final selection rule. That transparency helps readers judge whether the sampling method fits the claim.
A vague statement such as “records were sampled” leaves too much unclear. A statement such as “every 12th eligible record was selected after a random start of 4” gives the reader a much better view of the design.
It works well with many quantitative studies
When systematic sampling is used with a suitable frame, the resulting data can support many forms of quantitative analysis. Researchers may estimate means or proportions, compare groups, or examine relationships between variables.
For example, a systematic sample of student records may later be used in Pearson correlation when two quantitative variables are measured, Spearman’s rank correlation when ranked or ordinal patterns are more suitable, or Kendall’s tau when the analysis focuses on rank association. The sampling method does not choose the statistic by itself, but it helps explain where the data came from.
Limitations of Systematic Sampling
Systematic sampling is useful, but it is not safe in every situation. Its main weakness is the same feature that makes it easy: the fixed interval. If the interval lines up with a repeating pattern in the frame, the sample may overrepresent some units and miss others.
The method also depends on the quality of the frame, the handling of missing units, and the response process. A clear interval cannot solve gaps in the list, poor eligibility rules, or selective non-response. These limits should be discussed plainly when the method is reported.
Hidden periodicity can bias the sample
Periodicity means that the list has a repeating pattern. If that pattern matches the sampling interval, the sample may become tilted. This is the classic warning in systematic sampling.
Imagine a clinic schedule where appointment types repeat every 10 slots and the researcher selects every 10th record. The sample may include mostly one appointment type. Or imagine a school list sorted repeatedly by class groups, with every 25th name falling in a similar position. The method may look neutral, but the interval is quietly selecting a repeated category.
The frame can still exclude part of the population
Systematic sampling can only select from the frame. If a student list excludes part-time students who belong in the population, those students cannot be selected. If a hospital register omits records from one department, the interval will not reach them. This is a coverage problem, not an interval problem.
The researcher should describe the frame and any known gaps. If the frame is incomplete in a way that affects the research question, the final sample may not support broad claims about the intended population.
Non-response can weaken the final sample
A planned systematic sample is not the same as the final analytic sample. Selected people may decline, selected records may be unusable, and selected locations may be unreachable. If the missing units differ from the included units, the final data may be biased.
Researchers should report how many units were selected, how many were eligible, how many participated or were usable, and how many remained in the analysis. When possible, they should compare included and missing units on available information, such as age group, year, location, record type, or time period.
It may not produce enough cases in small subgroups
A systematic sample from one combined list may include too few cases from small groups. This can be a problem when the study plans subgroup comparisons. Ordering the list by subgroup does not automatically solve the issue, and it can create new pattern risks if the interval interacts with the order.
When subgroup counts are needed, stratified sampling or a stratified systematic design may be better. The researcher can define the subgroups first, then use a systematic procedure within each subgroup.
It can look more exact than it is
The interval gives systematic sampling a tidy appearance. A tidy procedure can still produce uncertain estimates. Sampling error, measurement error, response patterns, and frame coverage all remain part of interpretation.
For that reason, systematic sampling should not be described as if the interval alone guarantees a representative sample. The method gives a planned route through the frame. The quality of the final claim depends on the full design.
Conclusion
Systematic sampling gives researchers a clear way to move through an ordered frame. The method begins with a defined population, a usable frame, a planned sample size, a calculated interval, and a random start. From there, selection follows a simple rule: choose every kth unit until the sample is complete.
Its appeal is practical. It can reduce clerical work, spread the sample across a list, and make the selection procedure easy to report. It is especially useful when a long frame is available and the list order does not contain a repeating pattern that matches the interval.
At the same time, systematic sampling should be used with care. The researcher should inspect the frame, watch for periodicity, document non-response, and choose an analysis that fits the design. When those parts are handled together, systematic sampling becomes more than a convenient shortcut. It becomes a transparent probability-based method for selecting data from a wider population.
FAQs on Systematic Sampling
What is systematic sampling?
Systematic sampling is a probability sampling method in which a researcher selects units from an ordered sampling frame at regular intervals after choosing a random starting point. For example, the researcher may choose a random start between 1 and 10, then select every 10th unit.
What is an example of systematic sampling?
An example is a researcher selecting 200 students from a list of 2,000 eligible students. The sampling interval is 10. If the random start is 6, the researcher selects the 6th, 16th, 26th, and later every 10th student until the sample is complete.
How do you calculate the interval in systematic sampling?
The sampling interval is calculated by dividing the number of eligible units in the sampling frame by the desired sample size. If the frame has 1,500 units and the desired sample size is 150, the interval is 10.
What is the difference between systematic sampling and random sampling?
In simple random sampling, units are selected directly through a random procedure. In systematic sampling, the researcher chooses a random start and then selects every kth unit. Systematic sampling is often easier with long lists, but the order of the list must be checked for repeating patterns.
When should researchers use systematic sampling?
Researchers should use systematic sampling when they have a clear ordered sampling frame, want a simple probability-based selection rule, and have checked that the list order does not contain a repeating pattern that could distort the sample.
What are the limitations of systematic sampling?
Systematic sampling can be limited by hidden repeating patterns in the list, incomplete sampling frames, non-response, and weak subgroup coverage. The method is strongest when the frame is suitable, the interval is documented, and the final sample is reported clearly.


