Variable in Research refers to any characteristic, condition, concept, or measurement that can take different values across people, objects, settings, or time. A variable may be something directly counted, such as age or test score, or something more abstract that must be represented through indicators, such as anxiety, motivation, or social support.
This article explains what a variable in research is, how variables are grouped, which types appear most often in research design, and how to identify variables in a study without turning the process into guesswork.
What Is a Variable in research?
A Variable in research is a characteristic, condition, concept, or measurement that can vary from one case to another. The case may be a person, group, school, hospital, plant, text, event, country, or observation point. If the characteristic can take more than one value, category, score, level, or state, it can function as a variable.
In a study of student learning, for example, reading time, grade level, motivation, teaching method, and exam score can all be variables. Some can be counted directly. Others need careful definition before they can be observed. That is why variables in research are not only labels. They are decisions about what will be noticed, recorded, compared, and interpreted.
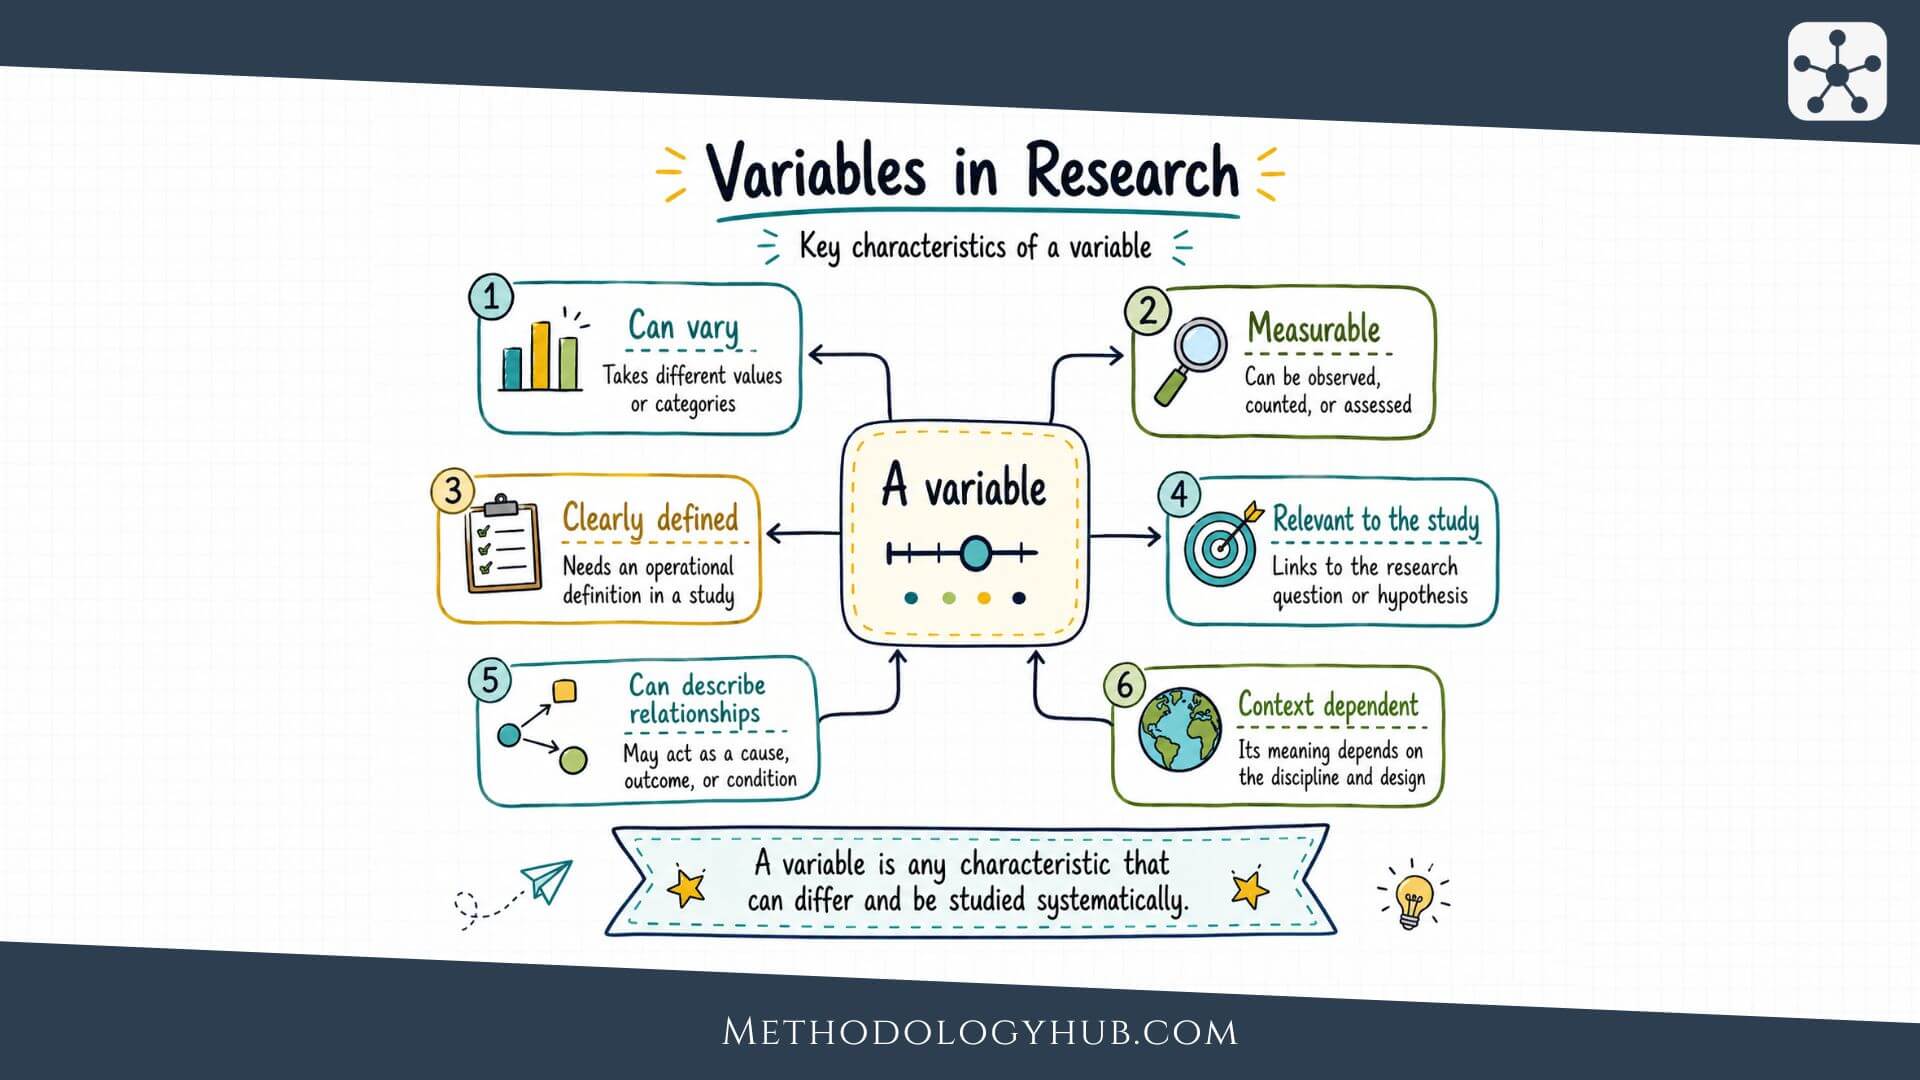
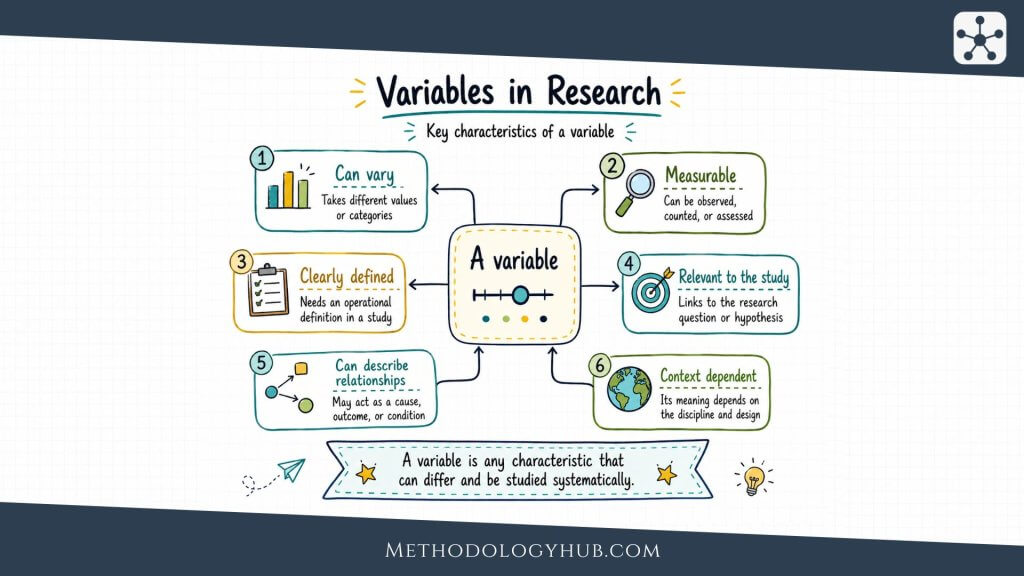
Key Characteristics of a Variable
A variable has three basic characteristics. First, it has a name, such as sleep duration or academic achievement. Second, it has possible values, such as six hours, seven hours, or eight hours of sleep. Third, it has a place in the study, which means the researcher knows whether it is being described, predicted, controlled, manipulated, or explained.
Those three features keep the concept practical. A variable that cannot be defined becomes hard to study. A variable with no variation cannot explain differences. A variable with no clear place in the design can confuse the analysis because the researcher may not know what comparison is being made.
- A variable must be identifiable: the researcher should be able to say exactly what is being examined.
- A variable must have possible variation: it should be able to differ across cases, time points, or conditions.
- A variable must fit the research question: it should help answer the question rather than sit in the study as extra information.
- A variable must be recorded consistently: the same rule should be used for each participant, object, or observation.
This is where many research designs begin to become clearer. Once the variable is named and its possible values are known, the study starts to move from a broad topic toward a workable design.
How Variables Differ Across Disciplines
Variables look different across disciplines because different fields study different kinds of evidence. In clinical research, variables may include blood pressure, diagnosis, treatment group, or symptom severity. In education, they may include prior achievement, study time, class size, or reading comprehension. In psychology, they may include memory score, stress level, reaction time, or self-reported confidence.
In social research, variables often describe people and contexts: age, income, language background, social network size, household composition, or institutional setting. In environmental research, they may describe temperature, soil moisture, species count, rainfall, pollution level, or land use. The word variable stays the same, but the form of evidence changes with the field.
Some disciplines also treat abstract concepts differently. A medical variable such as body temperature is usually measured directly. A psychological variable such as anxiety often needs several questionnaire items. A sociological variable such as social class may combine education, occupation, and income. The variable is still real for the study, but the path from concept to measurement is more layered.
Variables vs Constants
A variable changes. A constant stays the same within the study. This distinction is simple, but it shapes the whole design. If all participants in a study are first-year university students, year of study is a constant in that study. If the sample includes first-year, second-year, and third-year students, year of study becomes a variable.
The same characteristic can be a variable in one study and a constant in another. Room temperature might be held constant in a laboratory experiment so that it does not affect the result. In a study of heat and concentration, room temperature might be the independent variable. The status of a characteristic depends on how it is used.
This difference also helps researchers avoid confusion. A constant can be useful because it reduces unwanted variation. A variable is useful because it allows comparison. Good research design often depends on deciding which characteristics should vary and which should be kept stable.
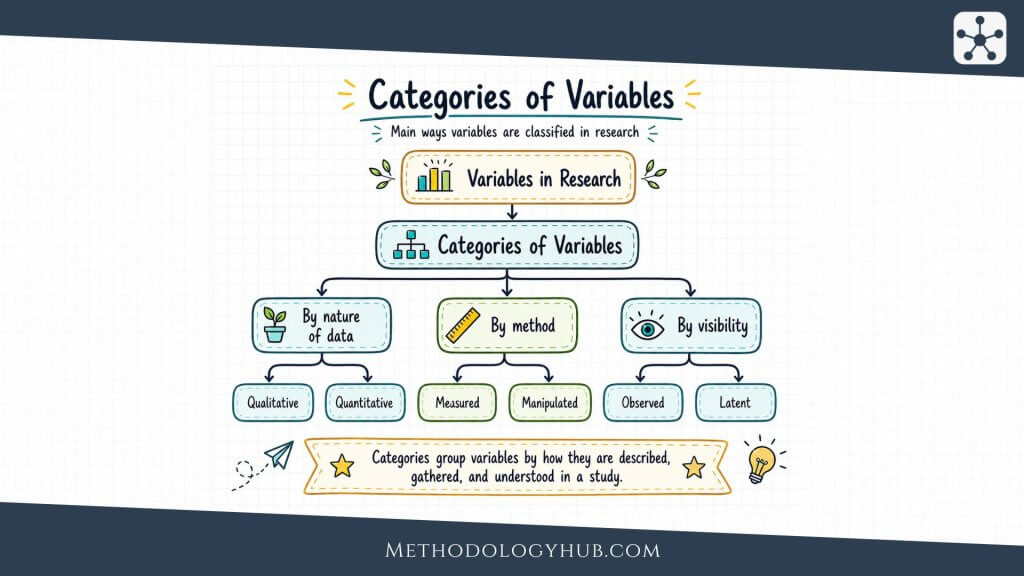
Categories of Variables
Variables in research can be grouped in several ways. These categories help researchers decide how a variable should be handled before the analysis begins. A variable may be qualitative, quantitative, measured, manipulated, observed, or latent. None of these labels works alone. They describe different sides of the same design decision.
For example, resting heart rate is usually a quantitative and measured variable. The type of instruction given to different groups can be qualitative and manipulated. Academic self-efficacy may be treated as latent when it is represented through several questionnaire items. The category tells the researcher what kind of evidence is being used and what kind of analysis may fit.
Qualitative Variables
A qualitative variable places cases into categories. These categories describe kind rather than amount. Examples include blood type, interview response category, field of study, diagnosis, school type, or plant species. The categories may have no order, as with blood type, or they may have a meaningful order, as with education level.
Qualitative variables are common in both qualitative and quantitative research. In an interview study, they may appear as themes, roles, or participant groups. In a statistical study, they may appear as coded categories in a dataset. The coding can make analysis easier, but it does not turn the underlying concept into a numerical amount.
Quantitative Variables
A quantitative variable uses numbers that represent amount, frequency, duration, score, or magnitude. Examples include age, number of correct answers, reaction time, height, weekly exercise hours, and concentration of a substance. Quantitative variables allow calculations such as means, differences, correlations, or rates of change.
The important point is that the number must carry measurement meaning. A participant ID number is not quantitative in the research sense because the number does not represent more or less of anything. By contrast, a reading score, a temperature value, or a count of errors can be treated quantitatively because the number reflects a measurable property.
Measured Variables
A measured variable is recorded as it already exists or appears in the study. The researcher does not assign its value. Age, prior achievement, diagnosis, language background, baseline anxiety, income, and previous exposure to a treatment are usually measured variables. The researcher observes or records them rather than creating them.
Measured variables are used in surveys, observational studies, clinical records, interviews, and many forms of secondary data analysis. They are useful because they show naturally occurring differences among cases. At the same time, they need careful interpretation. If a researcher measures two variables and finds an association, the result does not automatically show that one caused the other.
Manipulated Variables
A manipulated variable is deliberately changed by the researcher. In an experiment, a researcher might assign one group to receive a standard lesson and another group to receive a new lesson format. The lesson format is manipulated because the researcher controls which condition each group receives.
Manipulated variables are central to experimental design because they allow the researcher to compare outcomes under different conditions. If the design is strong, and if other influences are controlled, manipulation can support a clearer causal interpretation. The manipulated variable does not have to be numerical. It may be a treatment type, instruction format, stimulus condition, classroom activity, or laboratory setting.
Observed Variables
An observed variable can be recorded directly. A test score, age, reaction time, number of visits, attendance count, or measured temperature can be entered into a dataset as a visible measurement. The researcher may still need reliable instruments and consistent procedures, but the variable itself is close to the observation.
Observed variables often form the most immediate layer of research data. They are what the researcher can count, code, record, score, or measure. In many studies, observed variables stand on their own. In others, they serve as indicators of a broader concept that cannot be measured directly.
Latent Variables
A latent variable is not measured directly. It is inferred from several indicators. Concepts such as depression, motivation, reading confidence, social support, cognitive load, or institutional trust are often treated as latent variables. A researcher cannot place motivation on a scale in the same direct way as body mass. Instead, motivation may be represented by several questionnaire items, behavioral indicators, or repeated observations.
Latent variables require careful operationalization. The researcher must show how the indicators represent the concept. A weak set of indicators can make the variable unclear even when the statistical model looks neat. A strong set of indicators makes the hidden concept more usable in the study.
How Categories and Types of Variables Relate
Categories and types are connected, but they are not the same thing. Categories describe the form of a variable. Types describe the job a variable performs in a study. For example, an independent variable may be qualitative, as in treatment group, or quantitative, as in dosage. A dependent variable may be continuous, as in blood pressure, or ordinal, as in symptom severity ratings.
This is why it is useful to ask two questions. First, what kind of values does the variable have? Second, what is the variable doing in the study? The first question deals with measurement. The second deals with design. A clear study usually answers both.
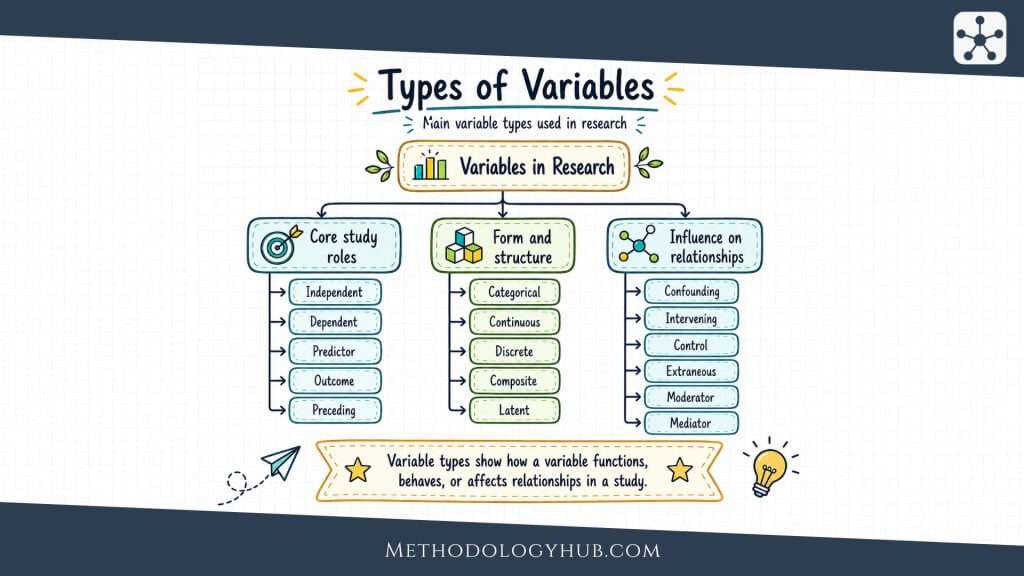
Types of Variables in Research
The main types of variables in research describe the function a variable has inside a study. The same variable can change type when the research question changes. Sleep duration may be an independent variable in a study of sleep and memory. It may be a dependent variable in a study of screen exposure and sleep. The label depends on the design.
This section explains the variable types students and researchers most often encounter. Some belong mainly to experimental research. Others appear in observational studies, prediction models, surveys, or theory-driven designs. The most useful approach is not memorising labels in isolation, but seeing how each one works in relation to the others.
Independent Variable
An independent variable is the variable expected to influence, predict, explain, or produce change in another variable. In an experiment, it is often manipulated. In an observational study, it may simply be measured as a possible explanatory factor.
In a study testing whether study schedule affects exam performance, study schedule is the independent variable. In a clinical study comparing two treatment conditions, treatment condition is the independent variable. The independent variable is not always the only cause of an outcome, but it is the variable the researcher places on the explanatory side of the question.
Dependent Variable
A dependent variable is the outcome, response, or result that the researcher examines. It is called dependent because its value is expected to depend in some way on the independent variable or on a set of predictor variables.
In a study of study schedule and exam performance, exam performance is the dependent variable. In a study of exercise and resting heart rate, resting heart rate may be the dependent variable. Good dependent variables are defined clearly because unclear outcomes make the research question harder to answer.
Categorical Variable
A categorical variable places observations into groups. Examples include treatment condition, marital status, school type, diagnosis category, type of feedback, or species. Categorical variables can be used as independent variables, dependent variables, control variables, or descriptive variables.
Some categorical variables are nominal, which means the categories have no natural order. Others are ordinal, which means the categories have a meaningful sequence. Knowing this difference helps researchers choose suitable summaries and statistical tests.
Continuous Variable
A continuous variable can take many possible values within a range. Height, temperature, reaction time, test score, and blood pressure are often treated as continuous. In practice, measurement tools may round values, but the concept itself exists on a continuum.
Continuous variables are common in quantitative research because they allow detailed comparison. They can show small differences between observations, which is useful when researchers want to examine relationships, trends, or average change.
Discrete Variable
A discrete variable takes separate countable values. Number of hospital visits, number of children in a household, number of correct answers, and number of publications are examples. Values usually move in whole units rather than through every possible decimal point.
The difference between discrete and continuous variables can affect analysis. Counting the number of events is not the same as measuring a smooth scale. Researchers need to choose summaries and models that fit the variable’s form.
Confounding Variable
A confounding variable is connected to both the presumed cause and the outcome in a way that can distort the relationship between them. If a study examines the relation between exercise and blood pressure, age may be a confounding variable if it is related to both exercise habits and blood pressure.
Confounding variables are especially relevant in observational studies. Because the researcher does not assign people randomly to conditions, groups may differ in ways that affect the outcome. Identifying possible confounders helps the researcher interpret the findings with more care.
Intervening Variable
An intervening variable sits between an independent variable and a dependent variable in a proposed sequence. It helps explain the process through which one variable may affect another. If teacher feedback improves student confidence, and confidence then improves participation, confidence may be treated as an intervening variable.
The term is often used in theory building. It tells the reader that the relationship is not being treated as immediate. Something happens between the starting condition and the outcome.
Predictor Variable
A predictor variable is used to estimate or forecast values of an outcome. Predictor variables often appear in regression models and observational research. They do not always imply experimental manipulation.
For example, prior test score, attendance, and study time may be predictor variables in a model of final exam score. The term is useful when the researcher wants to avoid suggesting direct causation and instead focus on prediction.
Outcome Variable
An outcome variable is the result that a study seeks to explain, compare, or predict. It is similar to a dependent variable, but the term is often preferred in clinical, educational, and policy research because it sounds less tied to a strict experiment.
Recovery time, reading score, symptom severity, graduation status, and patient satisfaction can all be outcome variables. The outcome variable should match the purpose of the study. A poor match can leave the research question only partly answered.
Latent Variable
A latent variable is a hidden or underlying concept represented through observed indicators. Depression may be represented through symptom items. Scientific reasoning may be represented through several tasks. Family support may be represented through questionnaire responses about emotional, practical, and informational help.
Latent variables are common when researchers study psychological, social, or educational constructs. They require careful measurement because the concept is never captured by a single observation alone.
Composite Variable
A composite variable is created by combining several items, scores, or indicators into one overall measure. A stress scale may combine responses to ten items. A socioeconomic index may combine education, income, and occupation. A health score may combine several clinical indicators.
Composite variables can simplify analysis, but the combination should be justified. Items should belong together conceptually, and the researcher should explain how the final score was created.
Preceding Variable
A preceding variable comes before another variable in time or logic. It may shape the conditions under which later variables appear. In a study of university achievement, prior schooling can be a preceding variable because it exists before university learning outcomes are measured.
This label is useful when researchers are building a sequence. It helps separate variables that come before the main relationship from variables that happen during or after it.
Control Variables
Control variables are included to reduce alternative explanations. They are not the main focus, but they are accounted for because they may influence the outcome. In an education study, prior achievement may be controlled when comparing two teaching methods.
Control variables should not be added mechanically. Each one should have a reason. Too few controls may leave rival explanations open. Too many poorly chosen controls can make the model harder to interpret.
Extraneous Variables
Extraneous variables are outside the main relationship but may still affect the dependent variable. Noise, fatigue, time of day, room conditions, prior exposure, or test anxiety can become extraneous variables depending on the study.
Researchers often try to reduce their influence through design choices: standard instructions, similar testing conditions, random assignment, or consistent timing. The aim is not to remove all real-world variation, which is often impossible, but to prevent irrelevant variation from overwhelming the comparison.
Moderator Variables
A moderator variable changes the strength or direction of a relationship between two other variables. For example, the relation between study time and exam performance may be stronger for students with regular attendance than for students with irregular attendance. Attendance would function as a moderator if it changes how study time relates to exam performance.
Moderators answer a conditional question: for whom, when, or under which conditions does the relationship appear? This makes them useful when a relationship is not the same across all groups or settings.
Mediator Variables
A mediator variable explains how or through what process one variable is related to another. If an instructional method improves motivation, and motivation then improves persistence, motivation may be a mediator between instruction and persistence.
Mediators answer a process question. They help researchers move from whether two variables are related to how that relationship may unfold. Mediators and moderators are sometimes confused, but their jobs are different. A mediator explains a pathway. A moderator changes the conditions of a relationship.
Variables in Research
Variables in Research connect the question, design, measurement plan, and analysis. A research question may begin in ordinary language, but variables turn it into something that can be studied. Instead of asking only whether a teaching method is effective, the researcher must define the teaching method, decide what outcome will represent learning, and identify other variables that may shape the result.
This is why variables are part of the architecture of a study. They help determine what data will be collected, how cases will be grouped, which comparisons will be made, and how the findings can be interpreted.
Role of Variables in Scientific Research
Variables help scientific research move from a broad interest to a testable or observable plan. A topic such as sleep and learning is too broad by itself. A research question might ask whether sleep duration is associated with memory performance among university students. Now sleep duration and memory performance become variables, and the study has a clearer shape.
Variables also support transparency. When a researcher defines the variables clearly, readers can see what was actually studied. This prevents confusion between the concept and the measurement. For example, learning is a broad concept. A vocabulary test score is one possible measurement of one part of learning. Good research writing keeps that distinction visible.
Variables in Experimental Research
In experimental research, variables are often arranged around manipulation and response. The researcher changes the independent variable and observes whether the dependent variable differs across conditions. Random assignment, controlled procedures, and standardised measurement help protect the comparison.
Consider an experiment testing whether feedback style affects revision quality. The independent variable may be feedback style, with two conditions: written comments only and written comments plus a short conference. The dependent variable may be revision quality, measured with a rubric. Prior writing ability may be used as a control variable. Time allowed for revision may be held constant.
This design works because each variable has a job. The study does not merely collect information. It arranges variables so that the comparison can answer the research question.
Variables in Observational Studies
In observational studies, the researcher does not assign the main conditions. Instead, variables are measured as they appear in the world. A researcher may examine the relation between physical activity and sleep quality, or between classroom attendance and final grades, without assigning participants to specific activity levels or attendance patterns.
Observational studies can reveal patterns, associations, and predictors. They can also be strong when the design is careful, the measurements are reliable, and relevant confounders are considered. Still, causal interpretation needs caution because groups may differ in many ways besides the main variable being studied.
Here the language of predictor and outcome variable is often useful. It keeps the analysis clear without pretending that the researcher has manipulated the predictor.
Operationalization of Variables
Operationalization is the process of turning a concept into something that can be observed or measured. It answers the question: how will this variable be represented in the study? Without operationalization, variables stay too abstract to guide data collection.
Take the concept of academic engagement. A researcher might operationalize it through attendance records, time spent on learning activities, participation ratings, and responses to a student engagement questionnaire. Each choice captures part of the concept. None is the concept itself.
Strong operationalization requires the researcher to define the concept, select indicators, explain the measurement procedure, and remain honest about limits. A variable can be useful without being perfect, but readers need to know what the measurement can and cannot show.
Levels of Measurement of Variables
Levels of measurement describe how variable values are organised. They tell the researcher what the values mean and what kinds of comparisons are reasonable. The four familiar levels are nominal, ordinal, interval, and ratio.
These levels are not just statistical labels. They affect how a variable can be summarised and how carefully the researcher should interpret distances between values. A variable measured at the nominal level cannot be averaged in any meaningful way. A ratio variable can support comparisons such as twice as much or half as much.
Nominal Variables
A nominal variable has categories with no inherent order. Examples include blood type, species, country, diagnosis group, school type, or research method used in a set of articles. The categories are different, but one is not naturally higher or lower than another.
Nominal variables are often summarised through counts and percentages. Researchers may compare how often categories appear or whether category membership is associated with another variable. The main point is classification, not ranking.
Ordinal Variables
An ordinal variable has categories with a meaningful order, but the distance between categories is not necessarily equal. Examples include satisfaction ratings, education level, pain severity categories, class rank, and agreement scales.
Ordinal variables can show direction. One response may be higher than another. Yet the difference between “agree” and “strongly agree” may not be the same as the difference between “neutral” and “agree.” This is why ordinal data should be interpreted with attention to the scale used.
Interval Variables
An interval variable has ordered values with equal distances between them, but no true zero point. Temperature in Celsius is the classic example. The difference between 20 and 30 degrees is the same size as the difference between 30 and 40 degrees, but 0 degrees does not mean the absence of temperature.
Interval variables allow meaningful comparison of differences. They do not support all ratio statements. It would not be accurate to say that 40 degrees Celsius is twice as hot as 20 degrees Celsius in the same way one might compare weight or duration.
Ratio Variables
A ratio variable has ordered values, equal distances, and a true zero. Examples include height, weight, age, income, reaction time, number of errors, and duration. Zero means none of the quantity being measured.
Ratio variables support the widest range of mathematical comparisons. A researcher can compare differences, calculate ratios, and interpret statements such as twice as long or half as many when the measurement is sound.
How to Identify Variables in a Study
Identifying variables in a study becomes easier when the research question is treated as a map. The question usually names the population, the main condition or characteristic, and the outcome or pattern being examined. Once those parts are visible, the variables usually appear more clearly.
The process should be slow enough to prevent false labels. Students often rush to call one variable independent and another dependent before they understand the design. It is better to ask what the study is trying to compare, explain, predict, or describe.
Step-by-Step Identification Process
Begin with the research question. Underline the main concepts. Then ask which concept is being examined as a possible influence, which concept is being treated as the outcome, and which other characteristics may affect the relationship.
- Step 1: Find the main research question or objective.
- Step 2: Identify the concepts named in the question.
- Step 3: Decide which concept is the possible cause, condition, predictor, or grouping variable.
- Step 4: Decide which concept is the outcome, response, or dependent variable.
- Step 5: Look for control, confounding, mediating, or moderating variables.
- Step 6: Check how each variable is operationalized.
After this, classify each variable by form. Is it qualitative or quantitative? Is it nominal, ordinal, interval, or ratio? Is it observed directly or represented through indicators? These questions help connect design labels to measurement labels.
Example of Variable Identification
Consider this research question: Does sleep duration predict memory performance among undergraduate students after controlling for caffeine intake and prior grade point average?
The population is undergraduate students. The predictor variable is sleep duration because it is used to estimate memory performance. The outcome variable is memory performance because it is the result being examined. Caffeine intake and prior grade point average are control variables because the researcher accounts for them while studying the relation between sleep and memory.
Now classify the variables by measurement. Sleep duration is quantitative and usually ratio because it is measured in hours and has a meaningful zero. Memory performance may be quantitative if measured as a test score. Caffeine intake may be quantitative if measured in milligrams or cups per day. Prior grade point average is quantitative, though the exact interpretation depends on the grading system.
Here is a second example: Do students who receive peer feedback revise their essays more effectively than students who receive only written instructor comments?
The independent variable is feedback condition. It is categorical because students are grouped by feedback type. The dependent variable is revision effectiveness, which must be operationalized. The researcher might use a rubric score, improvement between drafts, or ratings from trained evaluators. If prior writing achievement is included, it may be a control variable.
These examples show why variable identification is not only naming words in a sentence. It requires reading the design. The same phrase can serve different functions depending on the study’s purpose.
Conclusion
A variable in research is any characteristic, condition, concept, or measurement that can take different values across cases, groups, settings, or time. Once a study begins to take shape, variables give the research question a practical form. They show what will be observed, compared, changed, controlled, or explained.
The clearest way to understand variables is to read them in context. A variable can be qualitative or quantitative, observed or latent, categorical or continuous, independent or dependent, a control, a mediator, a moderator, or something else depending on how the study uses it. The same measured feature can play different roles in different designs, so the label should always follow the research question and method.
Good research writing makes those decisions visible. It defines each variable, explains how it is measured, identifies its role in the design, and uses consistent names from the method section to the results. When variables are handled carefully, the study becomes easier to plan, analyse, explain, and evaluate.
FAQs on Variables in Research
What is a variable in research?
A variable in research is any characteristic, condition, concept, or measurement that can take different values across people, groups, objects, settings, or time. Age, test score, teaching method, income level, anxiety score, and treatment group can all be variables when they are defined and used in a study.
What are variables in research?
Variables in research are the features a study observes, measures, compares, controls, or changes. They help connect the research question to the data. Some variables describe participants, some represent conditions or treatments, and others record outcomes that the researcher wants to explain or compare.
What is the difference between an independent variable and a dependent variable?
An independent variable is the variable used to explain, predict, or create a difference in another variable. A dependent variable is the outcome being measured. In a study on study time and exam score, study time may be the independent variable, while exam score is the dependent variable.
What is the difference between categorical, continuous, and discrete variables?
A categorical variable places cases into groups, such as degree program or feedback condition. A continuous variable can take many values along a scale, such as height, reaction time, or temperature. A discrete variable is counted in separate units, such as number of siblings, completed courses, or correct answers.
What is a confounding variable?
A confounding variable is an outside variable that is related to both the explanatory variable and the outcome variable. It can make a relationship appear stronger, weaker, or different from what it would be if the confounder were accounted for. Researchers often use design controls or statistical controls to reduce this problem.
What is the difference between a mediator and a moderator variable?
A mediator variable helps explain how or through what process one variable is related to another. A moderator variable changes the strength or direction of that relationship. For example, motivation may mediate the relation between feedback and performance, while prior experience may moderate how strongly feedback affects performance.
How do you identify variables in a research study?
To identify variables in a study, start with the research question. Look for what is being compared, predicted, explained, measured, or controlled. Then decide which variable is the outcome, which variable is explanatory, and which additional variables may function as controls, confounders, mediators, or moderators.
What are the four levels of measurement for variables?
The four levels of measurement are nominal, ordinal, interval, and ratio. Nominal variables name categories without order. Ordinal variables have ranked categories. Interval variables have equal distances between values but no true zero. Ratio variables have equal distances and a meaningful zero, such as weight or time.


