Sampling is the process of selecting a smaller group of people, cases, records, observations, or units from a larger population so that the researcher can study that group in a careful and manageable way. Instead of trying to collect data from everyone or everything that could possibly belong to a study, sampling gives the researcher a route into the population.
This article explains what sampling means in research, how a population differs from a sample, which sampling types are commonly used, and how ideas such as sampling bias, sampling error, and representativeness shape interpretation.
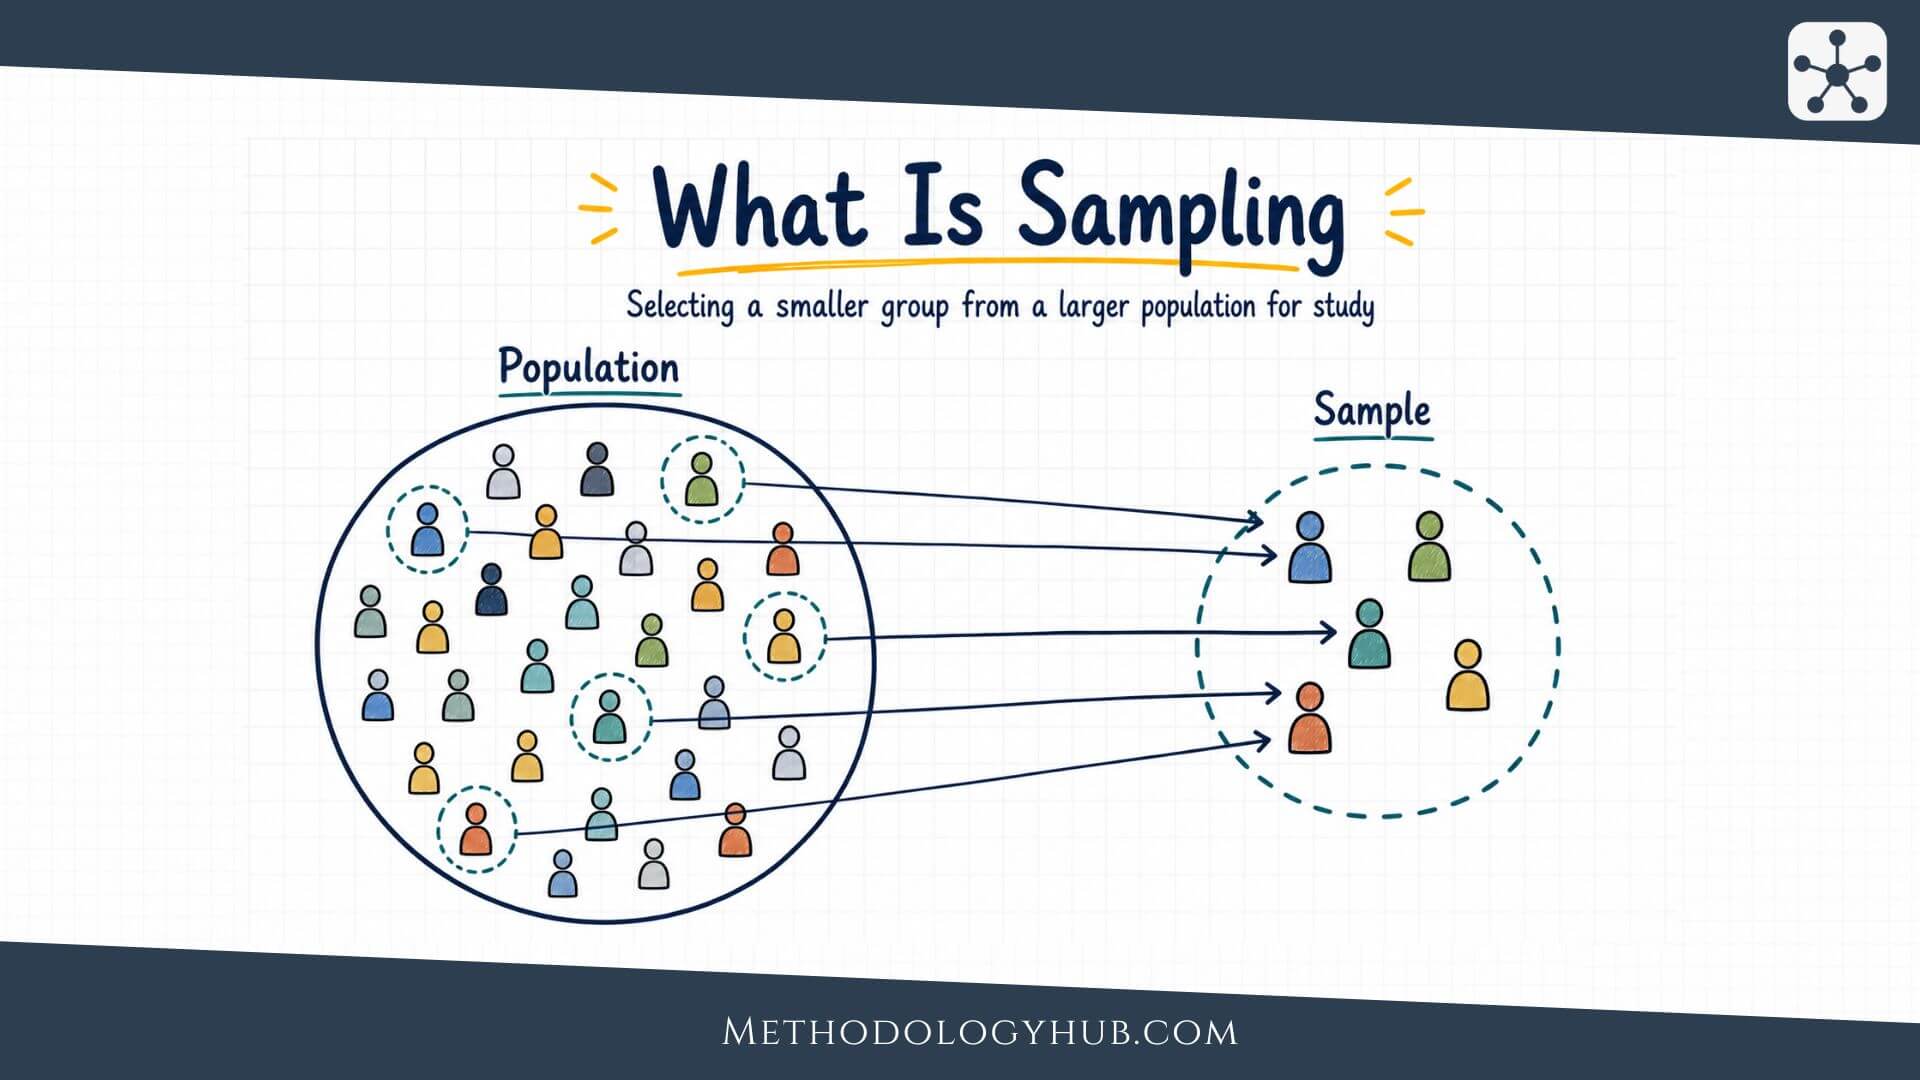
What is Sampling?
Sampling means selecting part of a population for study. The population is the full group the researcher is interested in. The sample is the smaller group actually observed, measured, interviewed, tested, or analysed.
A population can be made of people, but it does not have to be. It can also include schools, classrooms, hospital records, newspaper articles, soil samples, interview transcripts, laboratory specimens, social media posts, time periods, cities, or events. What counts as a population depends on the research question. A study of undergraduate study habits may define the population as all undergraduate students at one university. A study of air quality may define it as measurements taken across specific monitoring sites during a given year.
The purpose of sampling is not simply to make a project smaller. It is to make data collection possible while preserving a meaningful connection to the population. That connection may be statistical, as in probability sampling, or conceptual, as in many qualitative studies. Either way, the researcher needs to explain why the selected units are suitable for the question.
Sampling as a research decision
Sampling works best when it is planned early. A researcher who chooses a sample after the method is already fixed may discover that the available participants do not match the research question, that the sampling frame is incomplete, or that the final data cannot support the intended conclusion.
Good sampling begins with a few plain questions. Who or what belongs in the population. Which units can realistically be reached. What characteristics should be represented. What kind of claim will the study try to make. These questions keep sampling connected to design rather than treating it as an administrative step.
For quantitative studies, the sampling plan often affects how confidently the researcher can estimate population values, compare groups, or test hypotheses. For qualitative studies, the sampling plan often affects the depth, range, and relevance of the material. A small interview study does not need to look like a national survey, but it still needs a reasoned account of who was selected and why.
Unit of analysis and sampling unit
Another useful distinction is the difference between the unit of analysis and the sampling unit. The unit of analysis is the thing the researcher wants to make statements about. The sampling unit is the thing selected during sampling. Sometimes they are the same, but not always.
In a survey of students, the unit of analysis and the sampling unit may both be individual students. In a school-based study, however, the researcher may first sample schools, then classrooms, and then students. The final analysis may focus on students, but the first sampling unit was the school. In a study of hospital records, the unit of analysis may be patient visits, while the sampling unit may be records drawn from a database.
This distinction helps keep the method section precise. It also prevents confusion when the study has several levels. A researcher studying teaching may collect data from schools, teachers, classrooms, and students. Each level can play a different role. If the sampling unit is unclear, the reader may not know how the final evidence was produced.
For this reason, a strong sampling description often names the unit of analysis, the sampling unit, the inclusion criteria, and the route from population to final sample. That may sound detailed, but it usually makes the study easier to understand.
Population vs Sample
The difference between population and sample is one of the first ideas to settle in a research design. Without that difference, a study can sound broader than it really is. A researcher may collect research data from 120 students, for example, and then write as if the findings speak for all students everywhere. Sampling language helps prevent that kind of overreach.
The population is the full set of units that match the study’s definition of interest. The sample is the subset included in the actual study. The sample may be large or small, random or non-random, broad or narrow. What counts is whether the researcher defines both clearly and interprets the findings within those limits.

Target population and accessible population
Researchers often begin with a target population. This is the full group they would like to understand. In practice, however, they usually work with an accessible population. This is the part of the target population that can actually be reached through available records, institutions, locations, recruitment channels, or field sites.
For example, a study may be interested in first-year university students in Germany. That is the target population. If the researcher can only recruit students from three universities, the accessible population is narrower. The final sample may be narrower again, because not every eligible student will participate.
This distinction may seem small, but it affects how the study is described. A sample from three universities may still produce useful evidence, but the researcher should not write as if the study covered every first-year student in the country. Careful sampling language keeps the claim in proportion to the design.
Sampling frame
A sampling frame is the source or list from which the sample is drawn. In a survey, it might be a list of registered students, households, schools, patients, or employees. In archival research, it might be a database of court decisions or newspaper articles. In field research, it might be a set of sites or communities that meet the inclusion criteria.
The quality of the sampling frame is important because it shapes who has a chance to enter the study. If the frame excludes certain people or cases, the sample may miss part of the population before selection even starts. A student survey based only on a voluntary mailing list, for example, may not reach students who avoid university email or who are less connected to campus life.
That is why researchers often describe the frame in the method section. Readers need to know not only how many units were studied, but where those units came from.
From sample to inference
The connection between sample and population is what allows inference. Inference means drawing a reasoned conclusion from observed data to something beyond the observed cases. In a probability sample, inference can often be supported statistically because each unit has a known chance of selection. In a non-probability sample, inference is usually more cautious and depends on design logic, comparison, transparency, and the purpose of the study.
A sample does not need to be perfect to be useful. No study captures every feature of a population. The real question is whether the sample is good enough for the claim being made. A classroom experiment may not represent every student in every school, but it can still test a teaching procedure under defined conditions. A qualitative interview study may not estimate percentages, but it can still show how participants understand a particular experience.
Why Sampling Is Used in Research
Sampling is used because most populations are too large, too dispersed, too costly, or too complex to study in full. Even when a complete census seems possible, it may not be the best use of time or resources. A carefully selected sample can often answer the research question with less burden, less delay, and better control over data quality.
Sampling also helps researchers work with detail. Studying fewer cases can make it possible to measure more carefully, interview more deeply, check data more thoroughly, or follow participants over time. In that sense, sampling is not only about reducing size. It is also about creating the conditions for better evidence.
Practical Constraints
The most immediate reason for sampling is practical constraint. A researcher may not have the time, funding, access, staff, or equipment needed to study every unit in a population. A public health team cannot usually interview every adult in a region. A doctoral student cannot observe every classroom using a particular curriculum. A laboratory cannot test every possible specimen from a field site.
Sampling turns these limits into a design problem. Instead of asking, “How can I study everyone?”, the researcher asks, “Which group can answer this question well enough, and how should that group be selected?” That shift is useful because it makes the constraint visible and manageable.
Practical limits include:
- time: data collection may need to fit within a semester, grant period, field season, or clinical schedule
- cost: recruitment, travel, laboratory materials, transcription, and staff time can limit sample size
- access: some records, communities, institutions, or participants may be hard to reach
- burden: long surveys, interviews, repeated tests, or follow-up visits may reduce participation
- data quality: a smaller, better-managed sample may produce cleaner data than a larger rushed one
These limits do not weaken a study by themselves. They become a problem when they are ignored. A clear sampling plan shows how the researcher handled limits without pretending they disappeared.
Accuracy and Representativeness
Sampling can also improve accuracy when the design is careful. A complete census may sound stronger than a sample, but a census with poor measurement, missing responses, or inconsistent procedures can still produce weak evidence. A sample with clear rules, trained data collectors, and careful follow-up may be more reliable than a broad but messy attempt to include everyone.
Representativeness is the idea that the sample reflects the population in the features relevant to the study. In quantitative research, this often means that important population characteristics are present in suitable proportions or can be handled analytically. In qualitative research, it may mean that the sample includes participants or cases with the experiences needed to understand the phenomenon under study.
Accuracy and representativeness are connected but not identical. A study can measure a sample very accurately while still selecting the wrong sample for the question. It can also select a promising sample but collect data poorly. Strong sampling is one part of a larger design, and it works together with measurement, analysis, and interpretation.
Types of Sampling
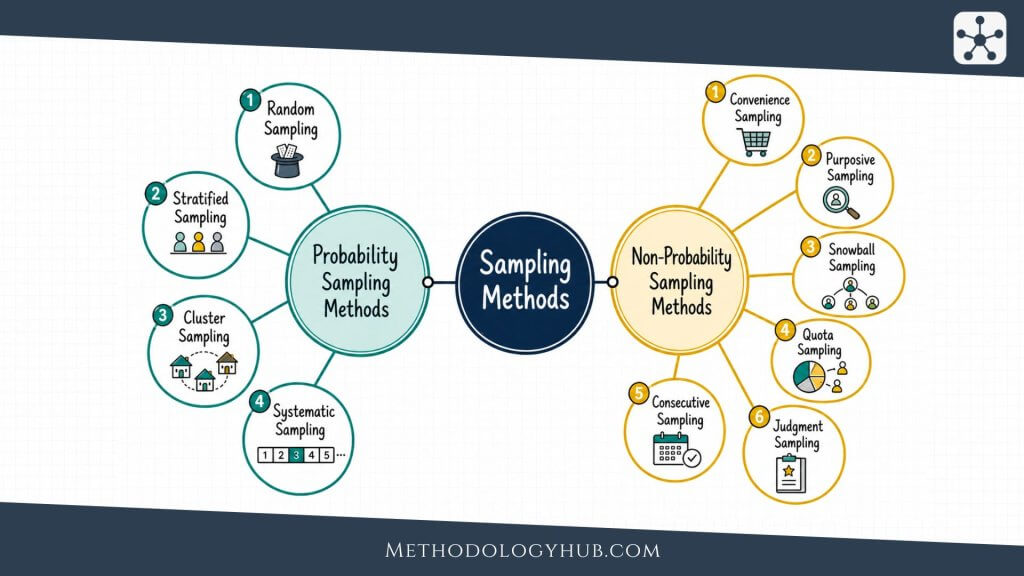
The main types of sampling are probability sampling and non-probability sampling. The difference is based on how units enter the sample. In probability sampling, each unit in the population has a known, non-zero chance of selection. In non-probability sampling, selection does not follow a known random process.
This distinction affects the kind of claim a study can make. Probability sampling is usually preferred when the goal is statistical generalization to a population. Non-probability sampling is common when the goal is exploration, depth, access to a specific group, or careful selection of information-rich cases.
Probability Sampling
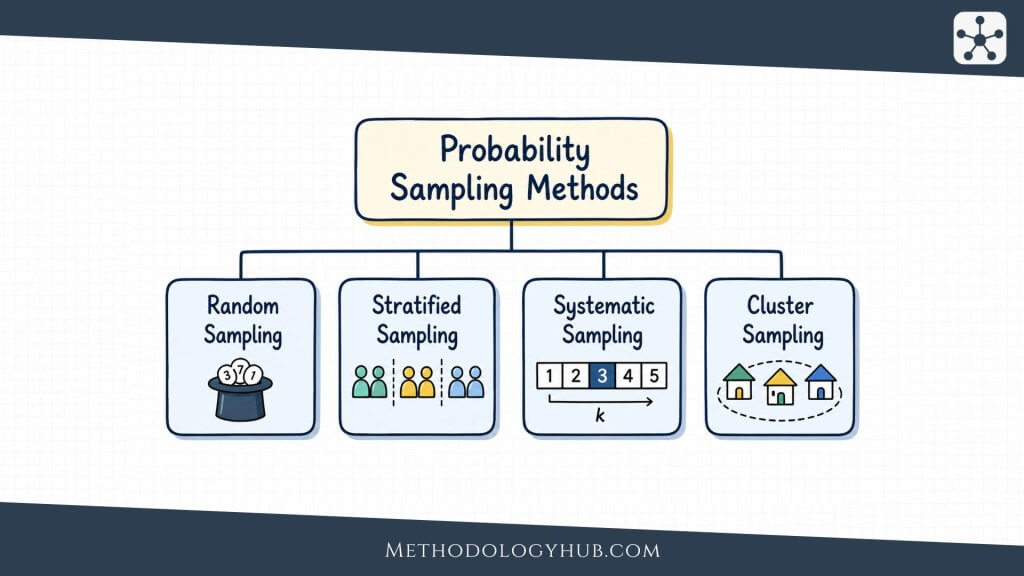
Probability sampling uses random selection. The word random does not mean careless or arbitrary. It means that selection follows a rule that gives units a known chance of being chosen. This is what allows researchers to estimate sampling error and make population-level statements with a defined level of uncertainty.
Common probability sampling methods include:
- random sampling: every unit in the sampling frame has an equal chance of selection
- systematic sampling: units are selected at regular intervals after a random starting point
- stratified sampling: the population is divided into groups, and units are sampled from each group
- cluster sampling: naturally occurring groups, such as schools or neighborhoods, are selected first
- multistage sampling: selection happens in several stages, often combining clusters and individuals
Random sampling is easy to explain but not always easy to use. It requires a fairly complete sampling frame. Systematic sampling can be efficient when units are listed in a usable order, although the order of the list should not create hidden patterns. Stratified sampling is useful when the researcher wants to make sure important subgroups are included. Cluster and multistage designs can reduce fieldwork costs when the population is spread across many locations.
The strength of probability sampling is not that every sample will be perfectly balanced. Random samples can still differ from the population by chance. The strength is that this uncertainty can be estimated. That makes probability sampling especially useful for surveys, prevalence studies, public opinion research, and other designs where population estimates are central.
Non-Probability Sampling
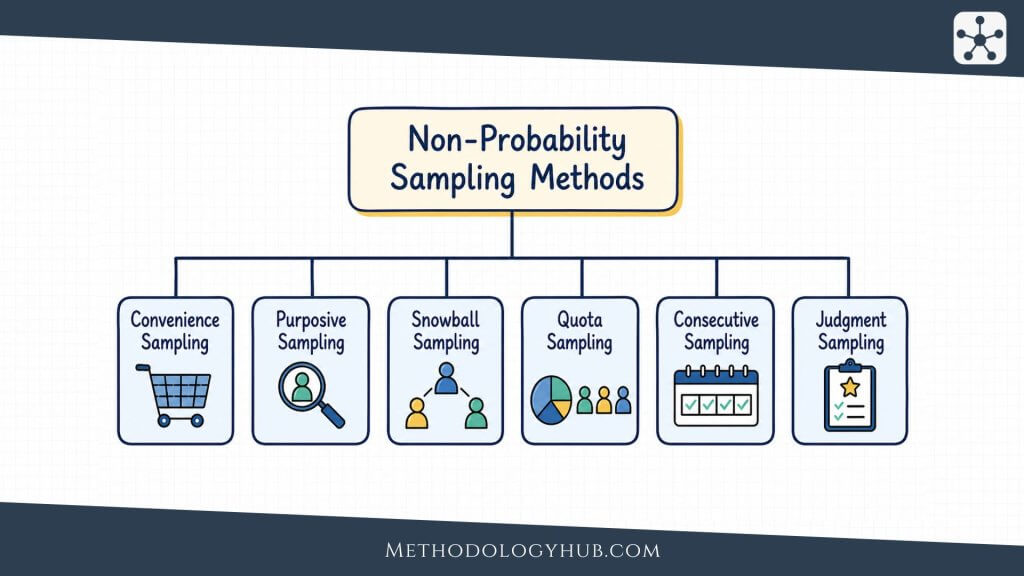
Non-probability sampling does not give every unit a known chance of selection. This does not automatically make it poor research. Many studies use non-probability sampling for good reasons, especially when the population is hard to list, the topic is sensitive, the study is exploratory, or the researcher needs participants with specific experience.
Common non-probability sampling methods include:
- convenience sampling: selecting units that are easy to reach
- purposive sampling: selecting units because they fit defined criteria or have relevant experience
- quota sampling: selecting participants until set categories are filled
- snowball sampling: asking participants to help identify other potential participants
- theoretical sampling: selecting new cases during analysis to develop or refine emerging ideas
Convenience sampling is common because it is simple, but it needs cautious interpretation. A group of volunteers from one class, clinic, or online forum may be useful for a pilot study, yet it should not be described as representative of a broad population unless the design supports that claim.
Purposive sampling is often stronger when the research question needs specific cases. A study of how newly qualified nurses experience night shifts, for example, should not recruit any available adult. It needs participants who have lived the situation being studied. The sample is not chosen to mirror a population statistically. It is chosen because the participants can provide relevant information.
Snowball sampling can help researchers reach groups that are not easy to identify through public lists. It can also narrow the sample through social networks, because participants may recruit people similar to themselves. For that reason, snowball sampling should be described clearly, including how recruitment began and how far the chain extended.
Key Concepts in Sampling
Sampling is easier to understand once three ideas are separated: sampling bias, sampling error, and representativeness. They are related, but they do not mean the same thing. Mixing them together often leads to weak method sections and overconfident conclusions.
Sampling bias refers to a systematic problem in how the sample is selected. Sampling error refers to random difference between a sample and the population. Representativeness refers to how well the sample reflects the population or study context in the features relevant to the question.
Sampling Bias
Sampling bias happens when the selection process makes some units more likely to be included than others in a way that distorts the findings. The problem is systematic, not random. If a student survey is distributed only through honors classes, students outside those classes have little or no chance of being included. The final results may describe a real group, but not the wider student population.
Bias can enter through the sampling frame, recruitment method, eligibility criteria, non-response, self-selection, or fieldwork procedure. Online surveys, for example, may miss people with limited internet access. Clinic-based studies may miss people who do not seek care. Volunteer samples may attract participants with stronger opinions or more available time.
The goal is not to pretend that bias can always be removed completely. The goal is to reduce avoidable bias and report the remaining limits clearly. A study can still be useful when its sample is limited, as long as the interpretation matches the design.
Sampling Error
Sampling error is the difference between a sample result and the true population value that occurs because the study observes a sample rather than the whole population. Even a well-drawn random sample can differ from the population by chance.
For example, if a researcher randomly selects 500 students to estimate average weekly study time, the sample mean may not equal the true mean for all students. Another random sample might produce a slightly different estimate. Sampling error is the uncertainty created by that variation.
In probability sampling, researchers can often estimate sampling error using statistical tools such as standard errors, confidence intervals, and margins of error. Larger samples usually reduce sampling error, although they do not automatically remove bias. A very large biased sample can still give a misleading result.
Representativeness
Representativeness means that the sample reflects the population or context in the ways that are relevant to the research question. In a national survey, this may involve age, gender, region, education, income, or other variables. In a clinical study, it may involve diagnosis, disease severity, treatment history, or setting. In a qualitative study, it may involve exposure to a phenomenon, variation in experience, or relevance to the developing analysis.
Representativeness is not achieved by sample size alone. A sample of 20,000 people can still be poorly representative if all were recruited from the same narrow source. A smaller sample can be better aligned with the question if it was selected through a well-designed frame or clear criteria.
A practical way to think about representativeness is to ask what the study needs to show. If the study wants to estimate a population percentage, representativeness has a statistical meaning. If the study wants to understand how participants make sense of a transition, representativeness may be less about percentages and more about including participants who can speak to that transition in relevant and varied ways.
Coverage and non-response
Coverage and non-response are two practical problems that often sit behind sampling quality. Coverage refers to who is included or excluded by the sampling frame. Non-response refers to who is selected or invited but does not provide usable data.
Coverage problems appear when the frame does not match the population well. A survey frame based on registered email addresses may miss people who do not use that account. A study based on clinic attendance may miss people who avoid or cannot access the clinic. A dataset of published articles may miss unpublished reports, withdrawn papers, or work in languages outside the database. In each case, the sample may look organized, but part of the population is missing before recruitment begins.
Non-response creates a different problem. The researcher may select a good sample, but some selected units do not participate, cannot be contacted, drop out, or provide incomplete data. If non-respondents differ from respondents in ways related to the study question, the final sample can shift away from the intended design.
Researchers can respond in several ways. They can improve contact procedures, send reminders, shorten instruments, offer flexible participation times, document response rates, compare respondents with known population characteristics, or adjust analyses when appropriate. None of these steps is a magic fix. They simply make the sampling process more visible and reduce the chance that missing people or cases silently reshape the findings.
Examples of Sampling in Research
Examples of sampling in research show how the same basic idea changes across designs. An experiment, a survey, an interview study, and a document analysis may all use sampling, but they do not all use it for the same purpose. The sample should fit the question, the method, and the kind of conclusion the researcher wants to draw.
This section focuses on two common settings: experiments and surveys. They are useful examples because they show two different pressures. Experiments often need samples that allow fair comparison between conditions. Surveys often need samples that allow credible description of a population.
Sampling in Experiments
In experiments, sampling begins before random assignment. Random assignment decides which condition participants receive, but sampling decides who enters the experiment in the first place. Those are different design decisions.
Imagine a study testing whether a new feedback method improves writing performance among first-year students. The researcher may recruit students from several introductory courses. That recruitment process forms the sample. After students enter the study, the researcher may randomly assign them to the new feedback method or to a standard feedback condition.
If the sample comes from only one course taught by one instructor, the experiment may still compare the two feedback conditions inside that course. It should be more cautious, however, about claiming that the method works for all first-year students. If the sample includes several courses, instructors, and student backgrounds, the interpretation may be broader.
Experimental sampling also affects feasibility. A tightly controlled laboratory study may use a smaller sample because each session is time-intensive. A classroom intervention may need more participants because outcomes vary across students and classes. In both cases, sample size and sampling method should be planned before data collection begins.
Sampling in Surveys
In surveys, sampling is often central because the researcher usually wants to describe a larger population. A survey of 1,200 adults may be used to estimate attitudes, behaviors, experiences, or needs across a city, region, institution, or country. The quality of the sample strongly affects whether those estimates are credible.
A probability survey may draw addresses, phone numbers, households, or registered members from a sampling frame. It may use stratification to make sure specific groups are included. It may also use weighting after data collection to adjust for known differences between the sample and the population.
Non-probability surveys are also common, especially online. They can be useful for exploratory work, pilot studies, student projects, and research with hard-to-reach groups. But the interpretation needs care. A survey shared on social media may produce many responses, yet those responses come from people who saw the link, chose to participate, and had access to the platform. A large number of responses does not by itself make the sample representative.
A good survey report usually describes the population, sampling frame, recruitment method, response rate when available, inclusion criteria, and any weighting procedure. These details help the reader judge what the results can and cannot say.
Sample size calculator
We at Methodology Hub created a free, privacy-friendly sample size calculator tool. You can use it to estimate the sample size needed for your study based on key statistical inputs. It is a practical tool for planning experiments, surveys, and research designs with adequate power. Click here to use the sample size tool.
The calculator is designed for academic users who know their study question but may not know the formula name yet. You choose the kind of study you are planning, and the calculator loads the fields needed for that design. This makes the planning step more concrete because the tool asks for the assumptions that shape the required sample size.
Depending on the study type, those assumptions may include confidence level, margin of error, expected proportion, expected effect size, group comparison, statistical power, population size, or planned allocation between groups. The exact inputs differ because a survey estimate is not the same as a two-group experiment, and a correlation study is not the same as a prevalence estimate.
Privacy-friendly use
The Methodology Hub sample size calculator runs locally in the browser. No login is necessary, no AI data processing is involved, and study inputs are not uploaded to a cloud server. That is useful for researchers who want to test assumptions during planning without sending project details elsewhere.
The result should be treated as a planning estimate, not as a final method section by itself. Researchers may still need to increase the sample to allow for non-response, missing data, dropout, subgroup analysis, cluster effects, or stricter precision requirements. In many real studies, the final planned sample is larger than the minimum returned by a calculator.
Conclusion
Sampling is one of the central decisions in research design because it determines where the evidence comes from. A study may have a strong question and careful analysis, but if the sample is poorly defined or poorly selected, the findings become harder to interpret.
The most useful way to approach sampling is to begin with the population, then work toward the sample. Define the group or material the study is about. Identify the accessible population and sampling frame. Choose a method that fits the question. Decide how many units are needed. Then report those decisions clearly enough that readers can judge the strength and limits of the study.
Probability sampling and non-probability sampling both have a place in research. Probability methods are usually strongest for population estimates and statistical generalization. Non-probability methods are often useful for focused, exploratory, qualitative, or hard-to-reach research contexts. The method should not be chosen because it sounds impressive. It should be chosen because it fits the job the study needs it to do.
FAQs on Sampling
What is sampling in research?
Sampling in research is the process of selecting a smaller group of units from a larger population for study. The units may be people, records, observations, cases, texts, places, or specimens. The aim is to collect useful evidence from a manageable group while keeping a clear connection to the wider population or research context.
What is the difference between a population and a sample?
The population is the full group the researcher wants to understand. The sample is the smaller group actually included in the study. A population might be all first-year students at a university, while the sample might be 300 students selected for a survey. Research findings should be interpreted according to how the sample was selected from the population.
What are the main types of sampling?
The two main types are probability sampling and non-probability sampling. Probability sampling uses random selection, giving units a known chance of inclusion. Non-probability sampling uses non-random selection, often based on access, criteria, judgment, or participant networks.
What is probability sampling?
Probability sampling is a sampling approach in which each unit in the population has a known, non-zero chance of being selected. Common forms include simple random sampling, systematic sampling, stratified sampling, cluster sampling, and multistage sampling. It is often used when researchers want to estimate population values or make statistical generalizations.
What is non-probability sampling?
Non-probability sampling is a sampling approach in which selection does not follow a known random process. Common forms include convenience sampling, purposive sampling, quota sampling, snowball sampling, and theoretical sampling. It is common in qualitative, exploratory, pilot, and hard-to-reach research settings.


