
Statistical methods give researchers a way to turn data into evidence. A dataset may contain measurements, categories, counts, ratings, or repeated observations, but those values do not explain themselves. Statistical methods help organize that information, show the patterns that are actually present, and judge how far the evidence can reasonably be taken.
This article explains what statistical methods are, how they differ from Statistical Analysis, which main types are used in research, and how a researcher can choose a method that fits the question, data, and study design.
What are statistical methods?
Statistical methods are formal ways of working with data. A method may summarize a dataset, describe uncertainty, compare groups, estimate an effect, test a claim, model a relationship, or predict an outcome. Some methods are numerical, such as calculating a mean or standard deviation. Others are model-based, such as fitting a regression model or estimating a survival curve.
The word “method” can sound more mechanical than the work really is. A statistical method is not only a formula. It is a way of matching a question to evidence. If the question is about the average score in one class, a descriptive summary may be enough. If the research question is about whether a treatment changed recovery time in a larger population, the method must handle sampling, comparison, uncertainty, and design.
That is why statistical methods are usually chosen after the research question has become clear. The same dataset can support several kinds of work. A researcher might describe it, compare groups inside it, model relationships among its variables, or use it to make predictions. The numbers do not decide that purpose by themselves. The method gives the data a structure, but the research question gives the method a reason to be there.
Statistical methods definition
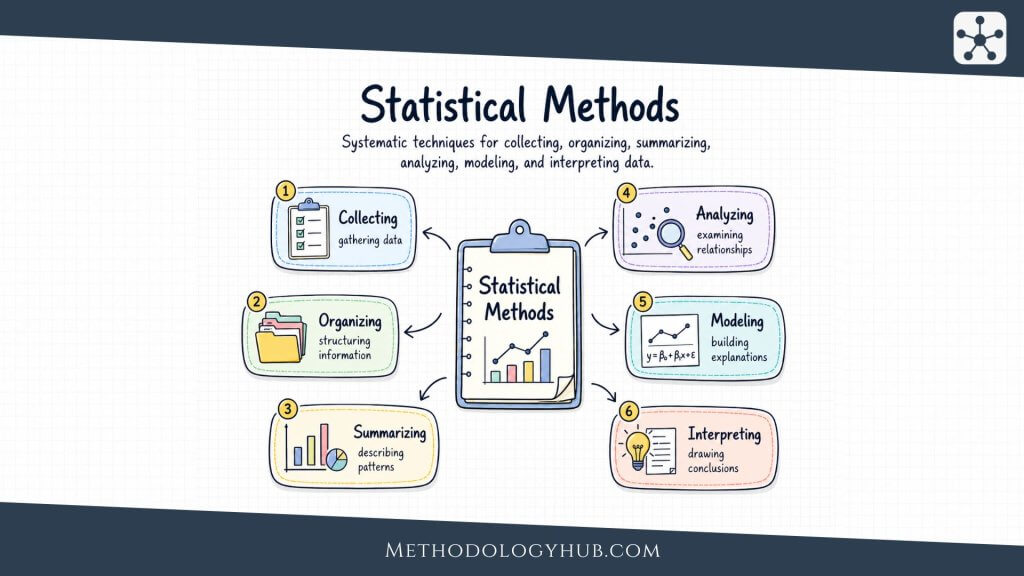
Statistical methods are systematic techniques for collecting, organizing, summarizing, analyzing, modeling, and interpreting data. They help researchers describe what is observed, estimate what may be true beyond the observed data, test hypotheses, examine relationships, and make decisions while acknowledging uncertainty.
This definition is broad because statistical work appears in many research settings. A clinical researcher may compare treatment groups. An education researcher may examine classroom outcomes. A public health researcher may estimate disease prevalence. A psychologist may study relationships among questionnaire scales. An environmental researcher may model measurements collected across space and time. The fields differ, but each one needs a disciplined way to reason from data.
Statistical methods vs statistics
Statistics is the wider field. It includes the theory of probability, inference, modeling, study design, measurement, and data interpretation. Statistical methods are the practical tools inside that field. They are the techniques researchers actually apply when they calculate a confidence interval, run an analysis of variance, fit a logistic regression model, or check whether two variables are associated.
It is useful to keep this distinction simple. Statistics is the discipline. Statistical methods are the tools. A research project uses those tools to answer a question with data.
Statistical methods vs Statistical Analysis
Statistical methods and Statistical Analysis are closely connected, but they do not mean the same thing. Statistical methods are the techniques themselves. The analysis is the wider process of choosing, applying, checking, and interpreting those techniques.
For example, a t-test is a statistical method. Deciding whether a t-test fits the research question, checking the structure of the data, interpreting the difference between groups, and reporting the result in context are parts of the statistical analysis. In the same way, linear regression is a method, while the full statistical analysis includes selecting predictors, checking assumptions, estimating uncertainty, and explaining what the model can support.
A short way to say it is this: statistical methods are the tools, and the analysis is the work of using those tools well. This page focuses on the toolbox. Our article on Statistical Analysis focuses on the process.
Core concepts in statistical methods
Statistical methods become easier to choose when the foundation is clear. Before a researcher asks which test or model to use, several earlier questions need attention. What kind of variable is being measured? How was the sample collected? Does the study compare groups, follow people over time, or examine variables as they naturally occur? Are the values counts, categories, ranks, times, or continuous measurements?
These questions are not a separate prelude to statistics. They are part of method selection. A method that works for continuous measurements may not work for ordered categories. A method that assumes independent observations may not fit repeated measurements from the same person. A method that estimates a population value from a sample depends on how that sample was obtained.
Data, variables, and measurement level
Data are the recorded observations that statistical methods work with. They may come from surveys, experiments, interviews, laboratory instruments, or existing datasets. A single dataset can contain raw measurements, grouped categories, repeated observations, missing values, and derived scores. Before any method is chosen, the researcher needs to understand how the data were collected, what each value represents, and whether the dataset is complete enough to support the question.
A variable is a characteristic that can take different values. Age, blood pressure, reaction time, diagnosis category, reading score, soil concentration, voting intention, and hospital length of stay are all variables. Before choosing a method, the researcher needs to know what kind of variable is being handled.
Categorical variables place observations into groups. Some categories have no natural order, such as blood type or region. Others are ordered, such as pain severity, satisfaction ratings, or disease stage. Numerical variables record quantities. Some are counts, such as number of errors or hospital visits. Others are continuous measurements, such as height, time, pressure, concentration, or temperature.
The measurement level affects what can be calculated. Nominal data support counts and proportions. Ordinal data support rank-based methods, but the distance between categories may not be equal. Interval and ratio data allow more numerical operations, although the distribution and design still need to be checked. A method is much easier to defend when the measurement scale has been named clearly.
Probability
Probability gives statistical methods a language for uncertainty. Research data rarely give perfectly fixed answers. A sample estimate can change from one sample to another. A clinical outcome may differ across patients. A laboratory measurement may vary slightly when repeated. Probability helps describe this variation without pretending it disappears.
At a basic level, probability describes how likely an event is. In research methods, it goes further. Probability distributions describe the range of values a variable may take and how those values are expected to appear. A normal distribution, binomial distribution, Poisson distribution, or survival distribution each carries a different picture of how data may behave.
This is one reason probability sits near the base of statistical methods. It supports confidence intervals, hypothesis tests, prediction intervals, Bayesian inference, risk modeling, and simulation. Even when a reader never sees the equations, probability is often working underneath the method.
Sampling
Sampling connects data to a wider group. A researcher usually cannot measure every patient, student, school, household, organism, or observation unit in a population. Instead, the researcher studies a sample and then asks what that sample can reasonably say about the larger group.
Good sampling is not only a question of size. A large sample can still be misleading if it leaves out the people or cases the study claims to describe. A smaller but carefully selected sample may be more useful than a larger sample collected from a narrow or convenient source. Statistical methods can measure random variation, but they cannot fully repair a sample that was never connected to the target population.
Sampling methods also explains why estimates vary. If several samples are drawn from the same population, their means, proportions, or correlations will not be identical. Sampling distributions describe that variation and make it possible to estimate uncertainty around the result.
Study design
Study design shapes the method before the calculation begins. A randomized experiment, a cross-sectional survey, a longitudinal cohort, a case-control study, an observational database, and a repeated-measures laboratory study all create different data structures. The method should follow that structure.
A comparison between two independent groups is not the same as a comparison between two measurements from the same people. A one-time survey is not the same as repeated data across several years. Patients nested within hospitals, students nested within classrooms, and repeated measures nested within individuals all create dependence that a simple method may ignore.
Design also controls the strength of interpretation. Some designs are mainly descriptive. Some support association. Some, especially randomized experiments and carefully planned quasi-experiments, can support stronger causal reasoning. Statistical methods can help with each design, but the method should not claim more than the design can support.
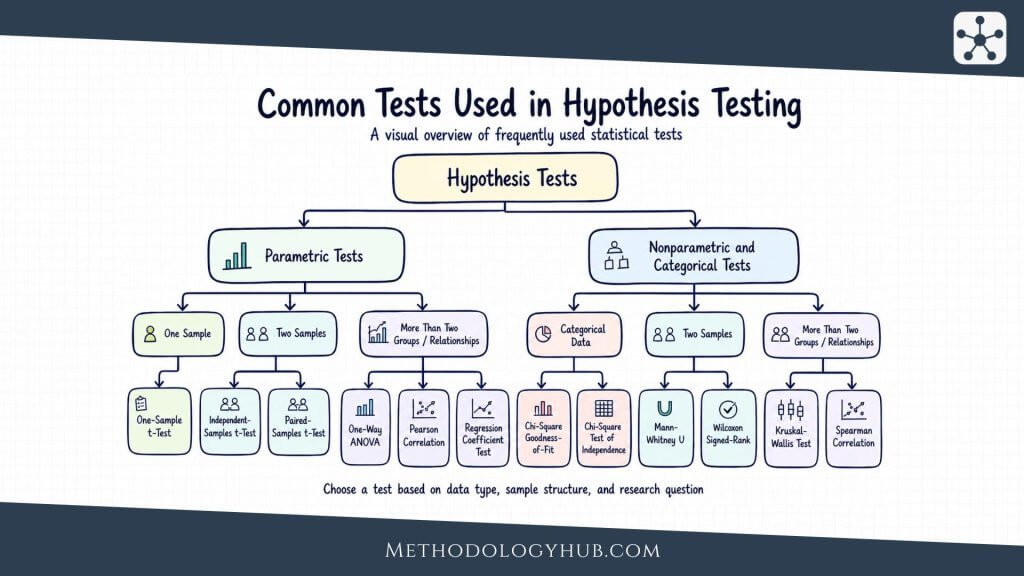
Types of statistical methods
Statistical methods can be grouped by the kind of question they help answer. Some methods describe a dataset as it stands. Others use a sample to estimate something about a wider population. Some compare groups, some study relationships, and some build models for more complex structures such as repeated measurements, time, events, or many variables at once.
These categories overlap in practice. A study may begin with descriptive statistics, use sampling methods to understand uncertainty, compare groups with a statistical test, and then use a regression model to examine several predictors together. The categories below should therefore be read as a map of the main statistical tools, not as separate boxes that never touch.
The easiest way to choose among them is to begin with the research question. A question about a typical value needs a different method from a question about association. A question about a sample needs different reasoning from a question about every observation in a dataset. Once the question is clear, the data type, study design, and assumptions begin to narrow the options.
Descriptive statistical methods
Descriptive statistical methods are often the first methods used because they make the dataset readable. Before a researcher tests a hypothesis or fits a model, the data needs to be inspected in plain terms. How many observations are there? Which values are typical? How much spread is present? Are there missing values, unusual scores, or categories that dominate the sample?
This stage can look simple, but it carries a lot of weight. A mean can be useful when values are balanced, but it can mislead when a few extreme observations pull it away from the rest of the data. A percentage can be clear in a large sample, but unstable in a very small one. A chart can reveal a pattern that a table hides. Descriptive methods do not make claims beyond the data by themselves. They give the reader a careful view of what has actually been observed.
Measures of central tendency
Measures of central tendency describe where values tend to sit. The mean gives the arithmetic average, the median gives the middle value after sorting, and the mode gives the most common value or category. These methods are used when the researcher needs a compact description of a typical value.
For example, a researcher studying reading scores may report the mean score for the class, but also the median if a few unusually high or low scores distort the average. In a survey of preferred study formats, the mode may be more useful than the mean because the answers are categories rather than measurements.
Measures of spread
Measures of spread describe how much variation exists. The range compares the smallest and largest values. The interquartile range focuses on the middle half of the data. Variance and standard deviation describe how far observations tend to sit from the mean.
For example, two groups of patients may have the same average recovery time, but one group may show much wider variation. Reporting only the average would miss that difference. Measures of spread show whether the typical value is surrounded by a tight cluster or by a wide range of outcomes.
Frequency tables and percentages
Frequency tables count how often each category appears. Percentages turn those counts into shares of the total. These methods are used with categorical data, such as diagnosis type, treatment group, school level, response option, or region.
For example, a public health researcher may report how many participants fall into each exposure category. A simple table can show whether most participants are concentrated in one category or distributed across several groups.
Charts and visual summaries
Visual summaries help the researcher see the shape of the data. Histograms show distributions, box plots show spread and possible outliers, bar charts show categorical counts, and scatter plots show relationships between two numerical variables.
For example, a histogram of reaction times may show that most participants respond quickly while a smaller number take much longer. That pattern can affect later method choice, especially if the planned method assumes a roughly symmetric distribution.
Inferential statistical methods
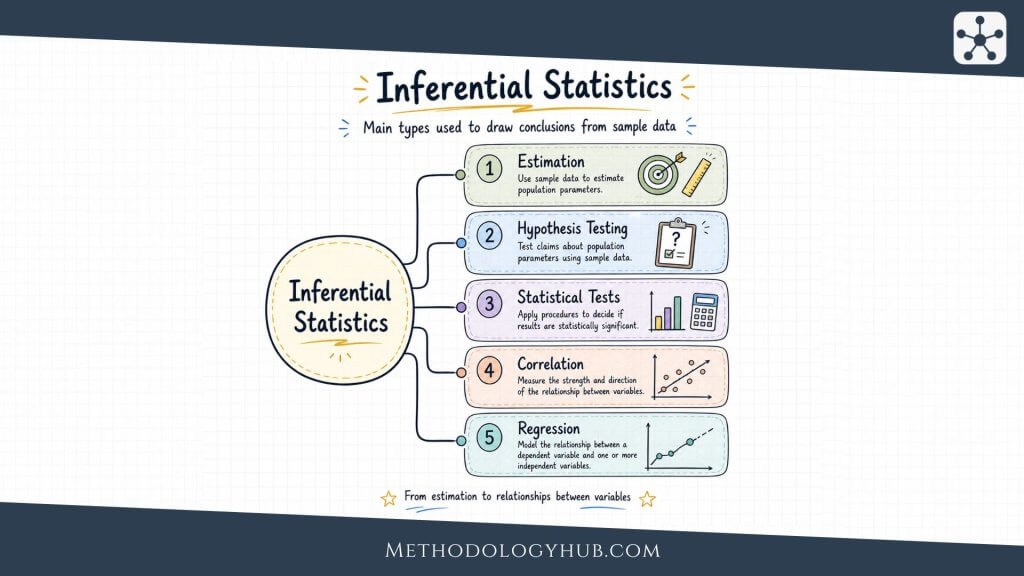
Inferential statistical methods enter when the researcher wants to move from observed data to a wider claim. A sample of students may be used to estimate a pattern in a school population. A group of patients may be used to learn about a treatment response in a broader clinical population. The move from sample to population is useful, but it also introduces uncertainty.
Inference does not remove that uncertainty. It gives it structure. Instead of saying that a sample mean is simply “the answer”, inferential methods ask how stable that estimate is likely to be, how much sampling variation may be present, and whether the observed pattern is strong enough to support the claim being made.
Sampling distributions
A sampling distribution describes how a statistic, such as a mean or proportion, would vary across repeated samples from the same population. Researchers use this idea to understand why one sample estimate may differ from another even when both samples are collected properly.
For example, one sample of 200 adults may estimate a health behavior rate at 34%, while another similar sample may estimate it at 37%. The difference may reflect sampling variation rather than a real change in the population.
Confidence intervals
Confidence intervals give a range of plausible values for a population quantity under the method used. They are used when the researcher wants to report both an estimate and the uncertainty around it.
For example, a study may estimate that the average difference between two teaching approaches is 4.2 points, with a confidence interval from 1.1 to 7.3 points. The interval gives more information than the estimate alone because it shows the range of values that remain compatible with the data and method.
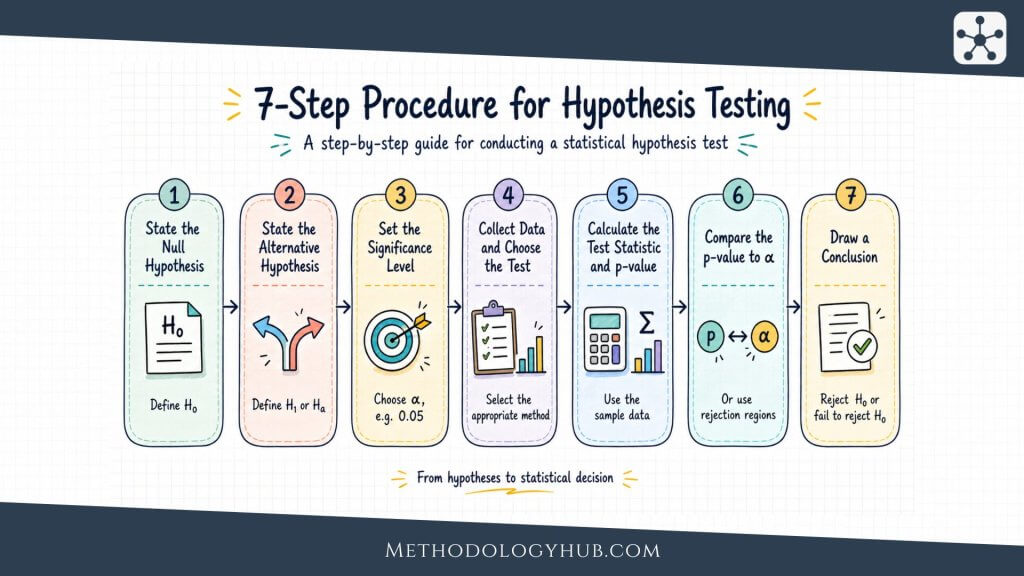
Hypothesis testing
Hypothesis testing compares observed data with what would be expected under a specific assumption, often called the null hypothesis. It is used when the researcher wants to judge whether a difference, association, or effect is difficult to explain by random variation alone.
For example, a researcher may test whether mean blood pressure differs between two treatment groups. The test does not say whether the difference is clinically large. It says how unusual the observed difference would be under the statistical assumptions of the test.
Standard errors
A standard error describes how much a sample estimate is expected to vary from sample to sample. It is used in confidence intervals, hypothesis tests, and many model outputs.
For example, a small standard error around a mean suggests that repeated samples would likely produce similar estimates. A larger standard error suggests that the estimate is less precise, often because the sample is small or the data is highly variable.
Comparative statistical methods
Comparative statistical methods are used when the research question asks whether groups, periods, conditions, or repeated measurements differ. The comparison may be simple, such as two independent groups, or more structured, such as the same participants measured before and after an intervention.
The method depends on the design as much as on the numbers. Comparing two unrelated groups is not the same as comparing the same people twice. Comparing three groups is not the same as comparing two. Categorical outcomes need different methods from continuous outcomes. A good comparison begins by naming exactly what is being compared.
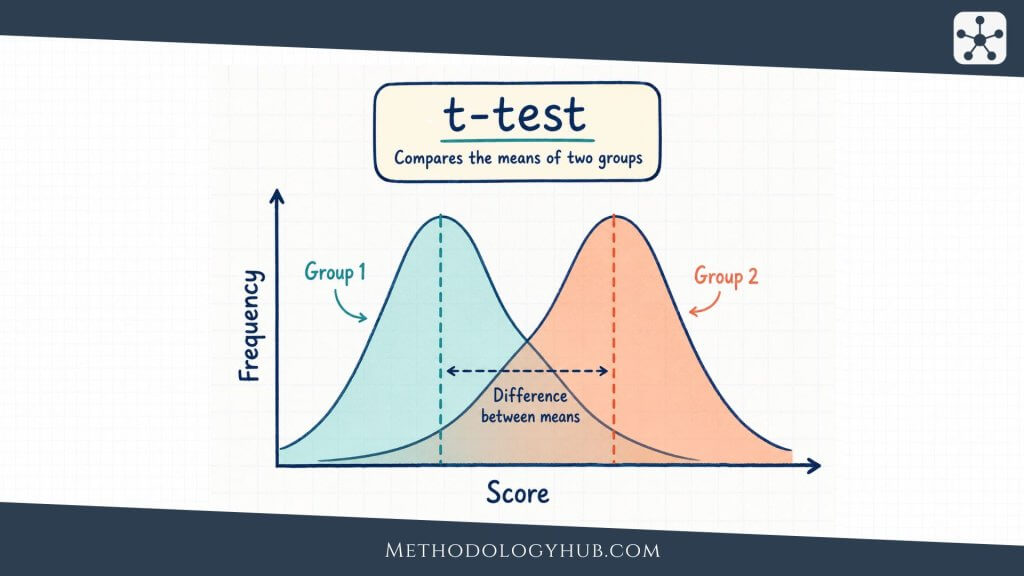
T-tests
T-tests are used to compare means when the outcome is numerical. A one-sample t-test compares a sample mean with a reference value. An independent-samples t-test compares two separate groups. A paired t-test compares two related measurements, such as before and after scores from the same participants.
For example, a researcher may use an independent-samples t-test to compare mean reading scores between two instructional groups. If the same students are measured before and after a reading program, a paired t-test would fit the design more closely.
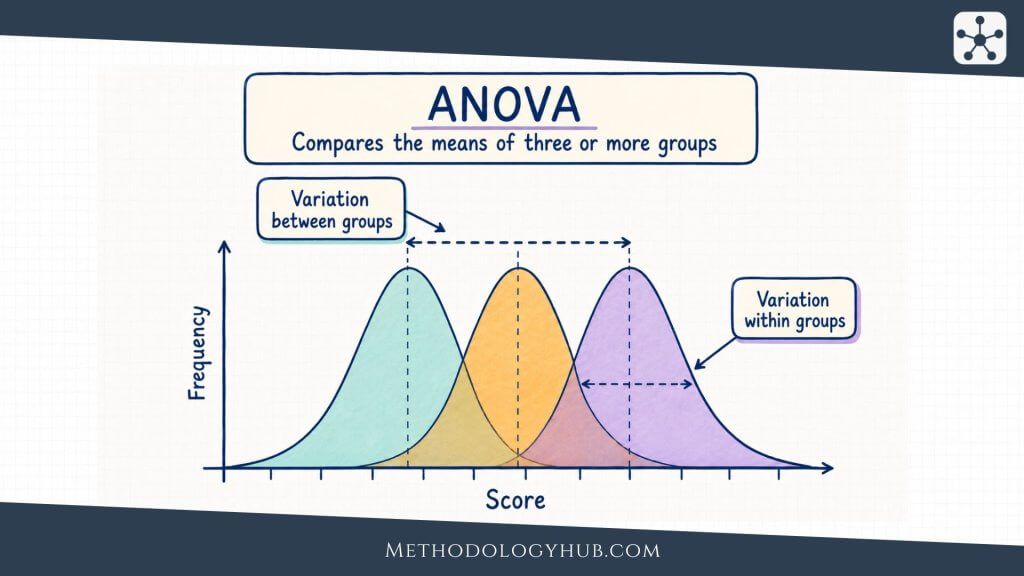
ANOVA
Analysis of variance, usually shortened to ANOVA, is used when the researcher compares mean values across more than two groups or conditions. It asks whether the variation between group means is larger than would be expected from variation within groups.
For example, an education researcher may compare exam scores across three teaching formats. ANOVA can test whether the group means differ overall. Follow-up comparisons may then examine which groups differ from each other.
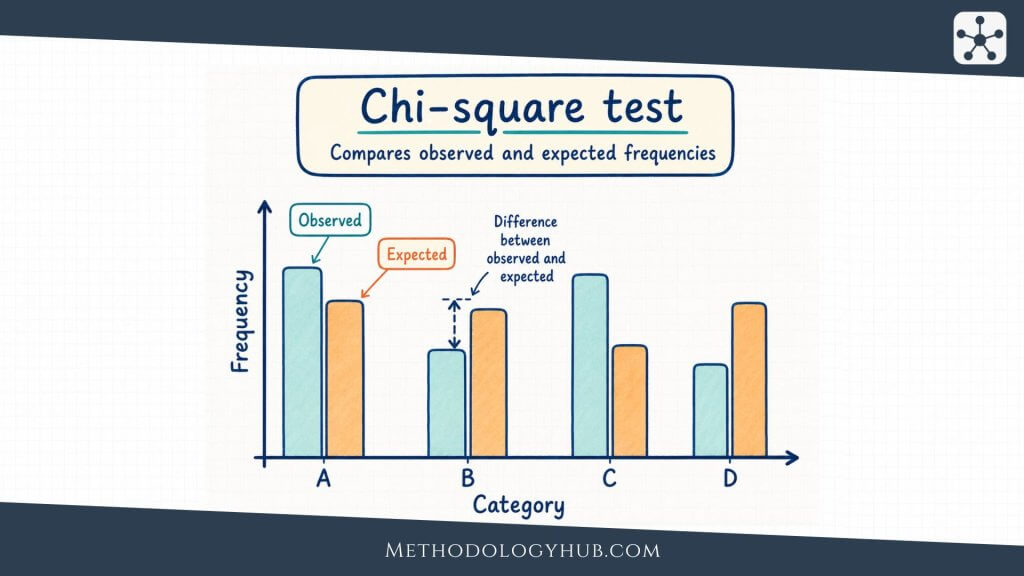
Chi-square tests
Chi-square tests are used with categorical data. They compare observed counts with expected counts under a specified assumption, often the assumption that two categorical variables are independent.
For example, a researcher may examine whether treatment preference differs by age group. The data would be arranged as counts in a table, and the chi-square test would assess whether the pattern of counts differs from what would be expected if age group and preference were unrelated.
Rank-based comparison methods
Rank-based methods are used when the data are ordinal, strongly skewed, or unsuitable for ordinary mean-based comparisons. Common examples include the Mann-Whitney U test, Wilcoxon signed-rank test, Kruskal-Wallis test, and Friedman test.
For example, pain severity ratings may be recorded on an ordered scale. If the distance between response categories is uncertain, a rank-based method may fit the data better than a comparison of means.
Correlation and association methods
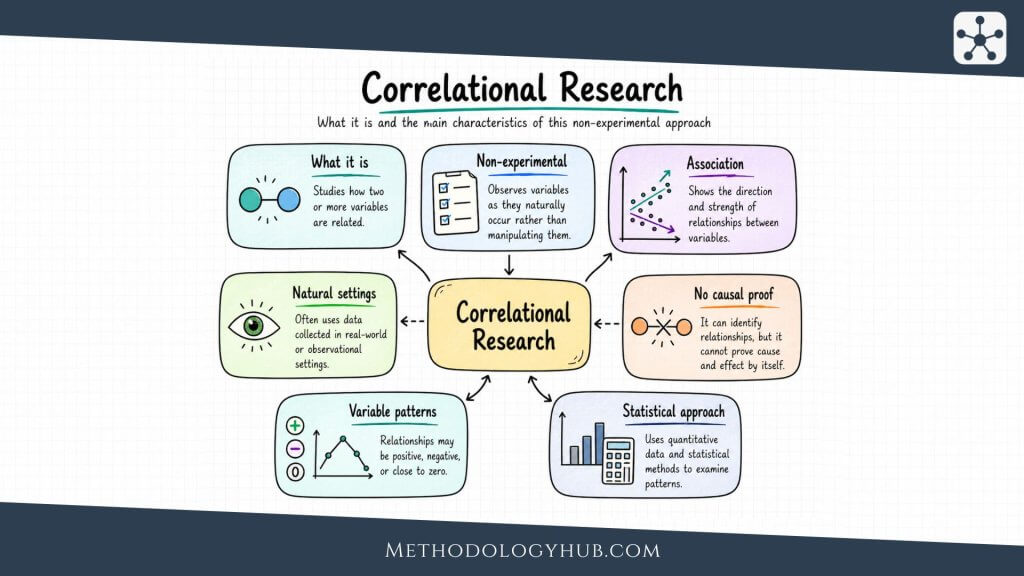
Correlation and association methods are used when the question is about relationships between variables. Sometimes the researcher wants to know whether two measurements move together. Sometimes the question is whether two categories appear together more often than expected. In correlational research, these methods are often used to describe relationships without manipulating the variables.
This group of methods should be read carefully. Association is not the same as cause. A relationship between variables may reflect a direct connection, a reversed direction, a third variable, measurement conditions, or a pattern that appears only in one subgroup. The method can describe the relationship, but the study design controls how far the interpretation can go.
Correlation analysis
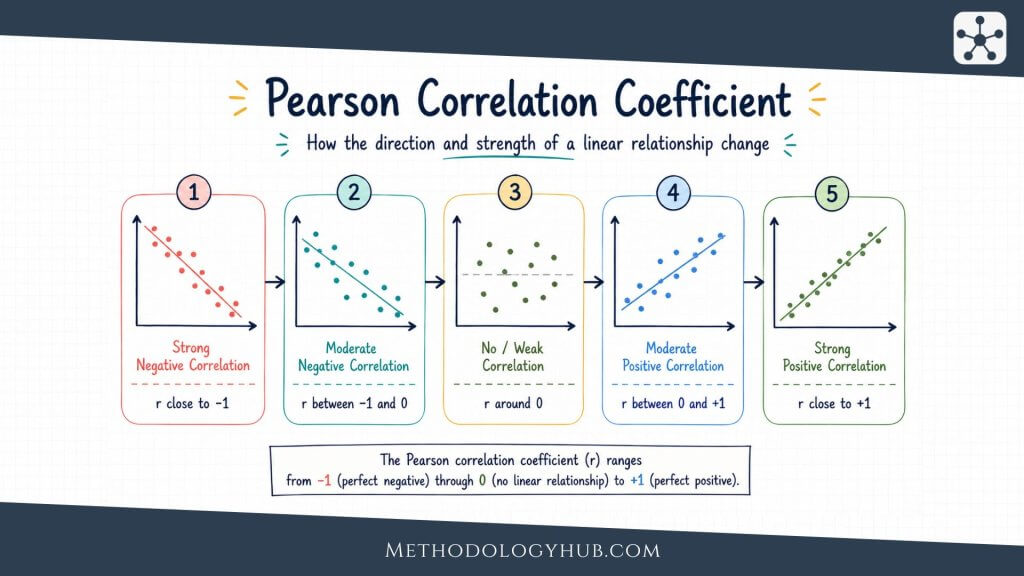
Correlation analysis measures the direction and strength of association between variables. Pearson correlation is commonly used for linear relationships between numerical variables. Spearman correlation and Kendall’s tau are often used for ordinal data or rank-based relationships.
For example, a researcher may examine whether study time is associated with exam score. A positive correlation would mean that higher study time tends to appear with higher scores, although it would not prove that study time caused the higher scores.
Cross-tabulation
Cross-tabulation displays the relationship between two categorical variables in a table. It is used when the researcher wants to see how counts are distributed across combinations of categories.
For example, a table may show treatment preference by diagnosis group. The pattern of counts can reveal whether one diagnosis group tends to choose a particular option more often than another.
Measures of association for categorical data
Categorical association can be summarized with measures such as odds ratios, risk ratios, Cramer’s V, or phi coefficients, depending on the design and variable structure. These methods are used when counts alone are not enough and the researcher needs a numerical summary of association.
For example, a health study may report a risk ratio comparing the probability of an outcome in exposed and unexposed groups. The ratio gives a clearer sense of relative difference than counts alone.
Partial association
Partial association methods examine the relationship between two variables while accounting for one or more additional variables. Partial correlation is one example. Regression models can also be used for this purpose.
For example, reading time and vocabulary score may be associated partly because both are related to age. A partial correlation can estimate the association between reading time and vocabulary after adjusting for age.
Regression and predictive modeling methods
Regression methods are used when the researcher wants to model an outcome using one or more predictors. This is where many research questions become more realistic. Outcomes are rarely linked to one factor alone. A reading score may be related to prior achievement, attendance, language background, and instructional conditions. A clinical outcome may be related to age, baseline health, treatment, and follow-up time.
Regression analysis can estimate relationships, adjust for measured variables, and support prediction. It is more flexible than a simple comparison or pairwise correlation, but it also asks more from the researcher. The outcome type, model assumptions, sample size, and design all shape the model that should be used.
Linear regression
Linear regression models a numerical outcome using one or more predictors. It estimates how much the outcome is expected to change when a predictor changes, holding other included predictors constant in multiple regression.
For example, a researcher may model final exam score using study time, attendance, and prior score. The model can estimate the association between study time and exam score while accounting for the other predictors included in the model.
Logistic regression
Logistic regression is used when the outcome has two categories, such as disease or no disease, pass or fail, completed or not completed. It models the probability of the outcome and often reports results as odds ratios.
For example, a clinical researcher may model whether a patient is readmitted to hospital within 30 days. Predictors might include age, diagnosis, prior admissions, and treatment history.
Count regression
Count regression methods, such as Poisson regression and negative binomial regression, are used when the outcome is a count. Counts often behave differently from continuous measurements because they cannot fall below zero and may be skewed.
For example, a researcher may model the number of clinic visits during a year. If the counts vary more than a simple Poisson model allows, negative binomial regression may fit the data better.
Prediction models
Prediction models estimate unknown or future outcomes. Regression can be used for prediction, but predictive work often places extra attention on validation, calibration, and performance on new data.
For example, a researcher may build a model to estimate the risk of disease progression. The model should not only fit the original dataset. It should also be tested on data that were not used to build the model.
Multivariate statistical methods
Multivariate statistical methods are used when the research question involves several variables at the same time. In some studies, one-variable-at-a-time analysis is too thin. A survey may include many items that seem to measure a smaller number of underlying concepts. A biological dataset may include many related markers. An educational dataset may contain several outcomes that should be studied together.
These methods help researchers study structure across variables. They can reduce complexity, find patterns, group observations, or examine several outcomes together. Their value depends on whether the multivariate structure has a clear research purpose. A complex method is only useful when it answers a question that simpler summaries cannot answer well.
Principal component analysis
Principal component analysis, often shortened to PCA, reduces a large set of related numerical variables into a smaller set of components. It is used when the researcher wants to summarize patterns of variation across many measures.
For example, an environmental researcher may have measurements of several soil chemicals. PCA can show whether a smaller number of components captures much of the variation across the chemical measures.
Factor analysis
Factor analysis is used to study latent constructs that are not measured directly. It examines whether several observed variables appear to reflect a smaller number of underlying factors.
For example, a questionnaire about academic motivation may include many items. Factor analysis can help examine whether those items group into dimensions such as persistence, confidence, and interest.
Cluster analysis
Cluster analysis groups observations that are similar across several variables. It is used when the researcher wants to identify patterns of similarity without assigning groups in advance.
For example, a researcher may group schools based on attendance, achievement, class size, and support services. The clusters may suggest profiles that deserve closer description, although they still need careful interpretation.
MANOVA
Multivariate analysis of variance, or MANOVA, compares groups across multiple related outcomes. It is used when several dependent variables are studied together rather than one at a time.
For example, a study comparing instructional approaches may measure reading accuracy, reading speed, and comprehension. MANOVA can test whether the groups differ across the combined outcome pattern.
Causal inference methods
Causal inference methods are used when the research question asks whether one thing changes another. This is a stronger claim than association. A correlation can show that variables move together. A causal question asks what would have happened under a different condition, treatment, exposure, or policy.
Randomized experiments give the clearest route when they are possible, because random assignment helps create comparable groups before the treatment begins. Many research questions, however, cannot be answered with random assignment. Researchers then use designs and methods that try to make the comparison more credible, while making the assumptions visible.
Randomized experiments
Randomized experiments assign units to conditions by chance. They are used when the researcher can control assignment and wants to estimate the effect of a treatment, intervention, or condition.
For example, students may be randomly assigned to two versions of a learning activity. If the groups are similar before the activity, later differences are easier to attribute to the assigned condition.
Matching methods
Matching methods compare treated and untreated units that are similar on measured characteristics. They are used in observational studies when random assignment is not available.
For example, patients receiving a treatment may be matched with similar patients who did not receive it, based on age, diagnosis, baseline severity, and other measured variables. The comparison becomes more balanced, although unmeasured differences can still remain.
Difference-in-differences
Difference-in-differences compares changes over time between a group exposed to a change and a comparison group not exposed to that change. It is used when the timing of a policy, program, or event creates a before-and-after structure.
For example, a researcher may study whether a new school attendance policy changed absence rates by comparing the change in affected schools with the change in similar unaffected schools over the same period.
Regression discontinuity
Regression discontinuity is used when assignment depends on a cutoff. Units just above and just below the cutoff are compared because they may be similar except for receiving the treatment or condition.
For example, students may receive additional support if their test score falls below a threshold. Comparing students just below and just above the threshold can help estimate the effect of receiving that support.
Instrumental variables
Instrumental variable methods are used when an exposure may be affected by unmeasured confounding, but there is a variable that influences the exposure without directly influencing the outcome except through that exposure.
For example, distance to a treatment center may influence whether a patient receives a service. Under strong assumptions, it may be used as an instrument to study the effect of the service.
Advanced statistical methods
Advanced statistical methods are used when the data structure asks for more than ordinary comparisons, correlations, or simple regression. The word “advanced” should not be read as better. A simple method that fits the question is usually stronger than a complex method used without a clear reason.
These methods are useful when observations are ordered in time, nested inside groups, censored by follow-up, connected through networks, or shaped by prior information. In these settings, ordinary methods may ignore part of the data structure and make the result look more certain or more general than it should.
Time series analysis
Time series analysis is used when observations are ordered over time and the sequence itself is part of the data. It examines patterns such as trend, seasonality, autocorrelation, and change after an event.
For example, a researcher may study monthly hospital admissions across several years. The method must account for the fact that one month may be related to the months before it.
Longitudinal models
Longitudinal models are used when the same units are measured repeatedly. They can study change within people, classrooms, clinics, sites, or other units over time.
For example, a researcher may measure student anxiety at the beginning, middle, and end of a semester. A longitudinal model can examine both average change over time and differences between students.
Survival analysis
Survival analysis is used when the outcome is time until an event. It can handle cases where the event has not yet happened by the end of observation, which is known as censoring.
For example, a clinical study may examine time until relapse after treatment. Some participants may relapse during follow-up, while others may not. Survival methods are built for that structure.
Bayesian methods
Bayesian methods combine prior information with new data to produce updated probability statements. They are used when prior evidence is meaningful, when uncertainty needs to be expressed directly, or when complex models are easier to frame probabilistically.
For example, a researcher may use previous studies to inform a prior distribution for a treatment effect, then update that estimate with data from a new study.
Monte Carlo simulation
Monte Carlo simulation studies uncertainty by repeatedly sampling possible values from probability distributions. It is used when a result depends on several uncertain inputs and a single fixed estimate would hide too much variation.
For example, a researcher planning a longitudinal study may simulate recruitment rates, dropout rates, and measurement variation to estimate the range of sample sizes that may be needed.
How to choose a statistical method
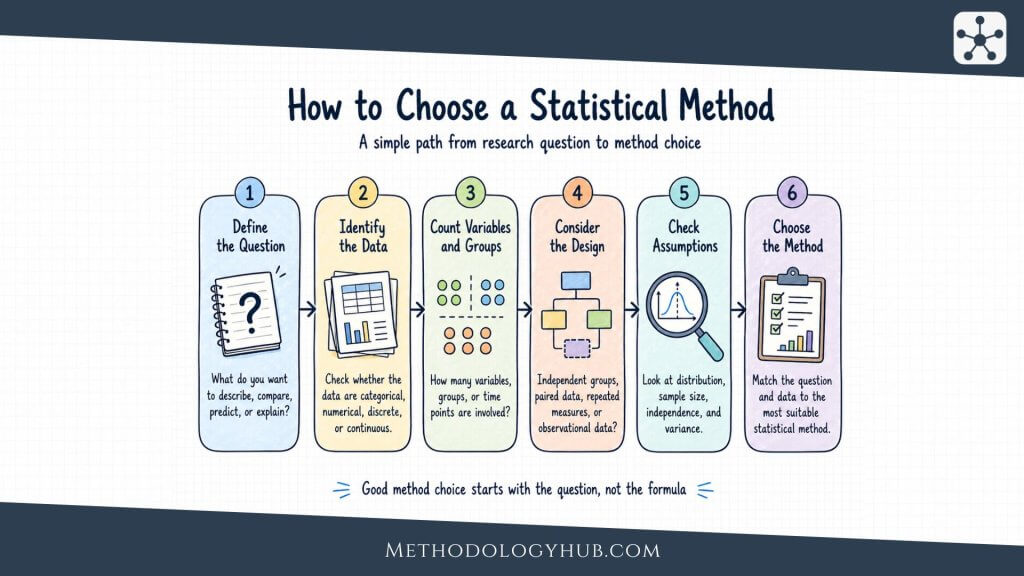
Choosing a statistical method is easier when the researcher begins with the question rather than the software menu. A statistical package may offer dozens of tests and models, but the data do not become clearer just because many options are available. The method should be selected because it fits the goal, the variable type, the design, and the assumptions that can reasonably be defended.
A useful method choice usually follows a sequence. First, define the research question. Next, identify the outcome variable. Then look at the predictors, groups, or time points. After that, check how the observations were collected and whether they are independent, paired, repeated, clustered, or ordered over time. Only then does the method name become meaningful.
Start with the research question
The research question tells the method what job it must do. A question about description may need only frequencies, means, medians, and plots. A question about population estimates may need confidence intervals. A question about group differences may need a comparative test or model. A question about prediction may need a model with validation. A question about cause and effect may need a design and method built around causal comparison.
Many weak method choices begin when the researcher starts with a familiar test and then tries to force the question into it. A better approach is slower at first but cleaner later. Write the question in plain language. Name the outcome. Name the comparison or relationship. Name the population or units. The method usually becomes easier to narrow after that.
Identify the outcome variable
The outcome is often the variable the researcher wants to describe, compare, predict, or explain. Its type strongly shapes the method. A continuous outcome can often be summarized with means or medians and modeled with linear methods if the assumptions are reasonable. A binary outcome may need proportions, risk differences, odds ratios, or logistic models. A count outcome may need count models. A time-to-event outcome may need survival methods.
This is one reason method choice cannot rely only on the research topic. Two studies in the same field may need different methods because their outcomes are different. A public health study of blood pressure, disease status, infection counts, and time to recovery may use four different method families.
Check the number and structure of groups
When the question compares groups, the number and structure of those groups guide the method. One group compared with a known value is different from two independent groups. Two independent groups are different from paired measurements. Several groups are different from repeated measurements across several time points.
The word “group” can also hide clustering. Students may belong to classrooms. Patients may belong to clinics. Observations may belong to sites, families, neighborhoods, or repeated sessions. When the same higher-level unit contributes several observations, the method may need to account for that dependence.
Look at assumptions
Every statistical method carries assumptions. Some assumptions concern the data: independence, distribution shape, equal variance, linearity, proportional hazards, or the absence of strong outliers. Other assumptions concern the design: random sampling, random assignment, no unmeasured confounding, stable measurement, or a suitable comparison group.
Assumptions should be checked before the result is treated as trustworthy. This may involve plots, residual checks, missing data review, influence diagnostics, model comparison, or sensitivity analysis. In many cases, the point is not to find a perfect method. It is to choose a defensible method and report its limits honestly.
Keep the result interpretable
A statistical method should produce an answer that can be explained. If the reader cannot tell what the outcome was, what comparison was made, what the estimate means, or how uncertainty was handled, the method has not served the research well.
Interpretability does not require oversimplification. A complex model can be explained clearly if the research question needs it and the report stays concrete. The difficulty begins when a method is selected because it sounds sophisticated rather than because it answers the question. A clean descriptive table can be stronger than a confusing model when the research task is mainly descriptive.
Statistical methods in research practice
In published research, statistical methods appear in more than one place. They influence the design, the data collection plan, the analysis section, the results, and the interpretation. A reader often sees them most clearly in a methods section, but their effect begins earlier.
For example, a researcher planning a longitudinal study needs to think about repeated measurement before the first observation is collected. A researcher planning a randomized experiment needs to decide how allocation will happen before the outcome is known. A researcher using a survey needs to know whether the measurement scale can support the intended summaries and models. Method choice is part of research planning, not only a step after data collection.
Planning the study
Statistical thinking begins with the study question, target population, variables, sample size, and design. A study that will compare two groups needs a clear outcome and a clear comparison. A study that will model several predictors needs enough observations for the planned model. A study that will examine change over time needs measurement points that match the expected pattern of change.
Planning also includes decisions about missing data, measurement reliability, randomization, blinding, coding, and data storage. These decisions may seem separate from statistical methods, but they shape what the later analysis can do. A method cannot recover an outcome that was never measured or a comparison group that was never defined.
Preparing the data
Before formal modeling begins, data need to be checked and prepared. This may involve reviewing missing values, impossible values, duplicate records, inconsistent coding, outliers, distribution shape, and variable definitions. These checks should be documented because they affect the analysis.
Data preparation should not become hidden editing. If cases are removed, categories combined, variables transformed, or outliers handled in a special way, the report should explain the decision. The reader needs to understand what data entered the method, not only which result came out.
Reporting the method
A statistical methods section should tell readers what was done in enough detail that the analysis can be understood and, when possible, repeated. It should name the variables, the method, the comparison, the software or package when relevant, the uncertainty measures, and any assumption checks or sensitivity analyses.
Clear reporting avoids both vagueness and overload. A sentence such as “data were analyzed statistically” is too thin. A long list of tests without a connection to the research question is not helpful either. The report should connect each method to the question it answered.
Interpreting the result
A statistical method produces an estimate, comparison, coefficient, interval, probability, classification, or model output. Interpretation turns that output back into research language. What was estimated? Which direction did the relationship take? How large was the effect? How much uncertainty remains? Does the design allow a causal interpretation, or only association?
Good interpretation stays close to the evidence. It does not make a small effect sound larger than it is. It does not treat statistical significance as practical importance. It does not describe an association as a cause unless the design supports that claim. The method helps structure the answer, but the writing must keep the claim within the evidence.
Examples of statistical methods in research
Examples help show how statistical methods fit different research questions. The method is not chosen because a field has a favorite tool. It is chosen because the question, data, and design point toward a certain kind of answer.
Education research example
Suppose an education researcher studies whether a new reading-support program is associated with higher comprehension scores among first-year students. The outcome is a numerical test score. The study has two groups: students who used the program and students who did not. If the groups are independent and the design is simple, the researcher may begin with descriptive statistics and then compare group means.
If students were measured before and after the program, the method changes. The data are now paired because each student contributes more than one score. If students are grouped within classrooms, the method may need to account for that clustering. If the researcher wants to account for prior achievement, attendance, or language background, a regression model may be more suitable than a simple group comparison.
Clinical research example
A clinical researcher may compare recovery time after two treatment protocols. If recovery time is recorded as a number of days and every participant has recovered by the end of follow-up, a comparison of means or a regression model may be reasonable. If some participants have not recovered by the end of the study, the outcome becomes time-to-event data with censoring, and survival analysis may fit better.
The same broad topic can therefore require different methods. A binary outcome such as recovered or not recovered may use risk ratios or logistic regression. A continuous outcome such as symptom score may use linear methods. A repeated outcome such as weekly symptom score may need longitudinal modeling.
Public health example
A public health researcher may estimate the prevalence of a condition in a population. The first method may be a proportion, followed by a confidence interval. If the sample came from a complex survey design, the analysis may need weights or design-based variance estimates. If the researcher wants to compare prevalence across age groups, sex, region, or exposure categories, the method may extend to stratified summaries or categorical models.
Here the central issue is not only the formula. The sampling plan controls how far the result can be generalized. A clean proportion from a poorly matched sample can look precise while describing the wrong population.
Environmental research example
An environmental researcher may measure pollutant concentration across several monitoring sites and seasons. Descriptive methods can summarize the distribution. Correlation can examine whether two pollutants tend to rise together. Regression can model concentration as a function of temperature, season, site characteristics, or distance from a source.
If observations are ordered over time, a time series method may be needed. If nearby locations tend to have similar values, spatial methods may be appropriate. If several pollutants are studied together, multivariate or mixture methods may become useful. The method follows the structure of the data.
Psychology research example
A psychology researcher may study several questionnaire scales related to stress, sleep, attention, and mood. The first step may be descriptive statistics and reliability checks. If the question is whether stress and sleep quality are associated, correlation may be used. If the question is whether stress predicts attention while accounting for sleep and mood, regression may fit better.
If several questionnaire items are intended to measure a smaller number of underlying constructs, factor analysis may be used. If the same participants report mood several times per day, multilevel models or repeated-measures methods may be needed. The method changes as the unit of analysis changes.
Tools for statistical methods
Statistical software helps researchers apply methods, check data, create graphics, fit models, and reproduce analyses. The tool should fit the task, the research setting, and the level of transparency required. Software can calculate quickly, but it does not decide whether a sample is appropriate, whether a model is suitable, or whether the interpretation is justified.
R
R is widely used in statistics, research, and teaching. It supports descriptive statistics, graphics, regression, multilevel modeling, Bayesian modeling, survival analysis, time series, simulation, and reproducible reports. Its package system makes it useful for both standard methods and specialized research areas.
Python
Python is widely used for data preparation, scientific computing, modeling, and reproducible workflows. Libraries such as pandas, NumPy, SciPy, statsmodels, scikit-learn, matplotlib, and PyMC support many statistical and computational tasks. Python is often useful when statistical work is combined with data processing, text analysis, simulations, or larger research pipelines.
SPSS, SAS, Stata, and spreadsheets
SPSS is often used in applied social science, psychology, education, and health research because it provides menu-driven procedures. SAS is common in clinical and regulated research settings. Stata is widely used in epidemiology, economics, public health, and social science. Spreadsheets can help with small descriptive summaries and simple charts, but they become risky when the analysis requires reproducibility, audit trails, or complex modeling.
The tool is less important than the match between method and question. A simple table created carefully can be more useful than a complex model produced without checking the data. A reproducible script can also protect the analysis by making each step visible.
Conclusion
Statistical methods give researchers structured ways to work with data. They help describe what has been observed, estimate uncertainty, compare groups, examine relationships, model outcomes, and support careful interpretation. The method is strongest when it fits the research question, the variable type, the sampling plan, and the study design.
Most research does not need the most advanced method available. It needs a method that answers the question honestly. Sometimes that means a clear table, a well-chosen graph, and a confidence interval. Sometimes it means regression, multilevel modeling, survival analysis, causal inference, or simulation. The difference comes from the data and the claim being made.
A good statistical method should leave the reader with a clearer view of the evidence. What was measured? What was compared? What was estimated? How uncertain is the result? What does the design allow the researcher to say? These questions keep statistical methods connected to research rather than turning them into a list of formulas.
FAQs on statistical methods
What are statistical methods?
Statistical methods are techniques used to describe data, estimate uncertainty, compare groups, study relationships, build models, and interpret research evidence.
What are the main types of statistical methods?
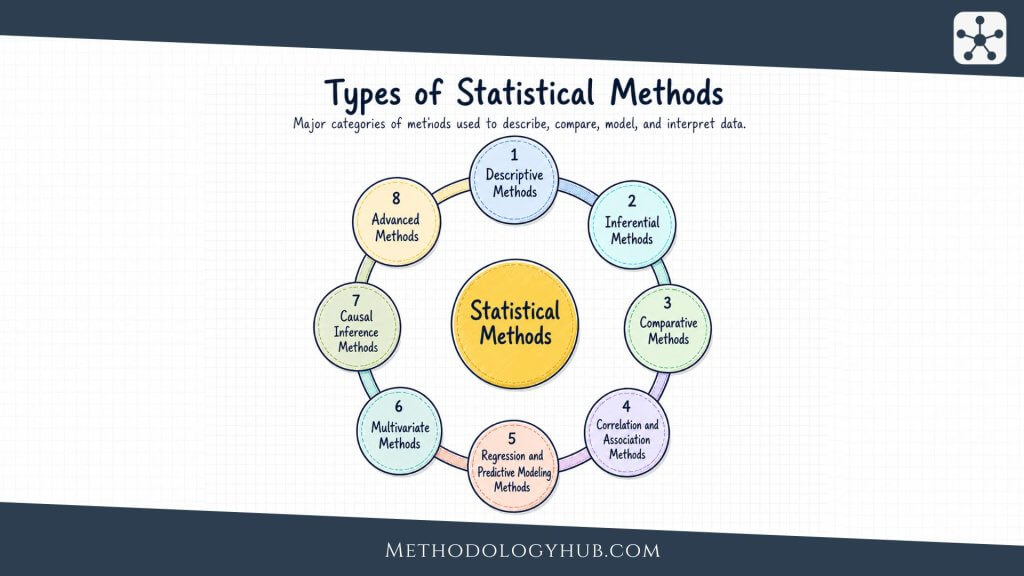
The main types include descriptive methods, inferential methods, comparative tests, association methods, regression methods, multivariate methods, causal inference methods, and advanced methods for complex data.
How do I choose a statistical method?
Start with the research question, then identify the outcome variable, the groups or predictors, the study design, the sample structure, and the assumptions that the method requires.
What is the difference between statistical methods and the analysis process?
Statistical methods are the techniques used to work with data. The broader Statistical Analysis process is the work of choosing, applying, checking, and interpreting those techniques.
Are statistical methods only used in quantitative research?
Statistical methods are mainly used with quantitative data, but they can also support mixed-methods research when qualitative material is coded into variables or combined with numerical evidence.
What software is used for statistical methods?
Common tools include R, Python, SPSS, SAS, Stata, and spreadsheets. The right tool depends on the method, the research setting, and the need for reproducibility.


