ANOVA, short for analysis of variance, is a statistical test used to compare mean values across groups. It is most often used when a researcher has one numerical outcome, such as a test score, reaction time, income value, plant height, or scale score, and wants to know whether the average outcome differs across three or more groups.
This article explains what ANOVA is, how the F statistic works, when to use ANOVA, which assumptions need attention, how different types of ANOVA are used, how to run a simple example, how to interpret the result, and how to report ANOVA in academic writing.
What Is ANOVA?
ANOVA is a method in inferential statistics for comparing group means. The test asks whether the differences among the sample means are large enough, relative to the variation inside the groups, to provide evidence that at least one population mean is different.
A simple education example helps make the idea concrete. Suppose a researcher compares exam scores from students taught with three lesson formats: lecture, guided practice, and small-group discussion. The sample means are 72, 76, and 81. Those numbers are not identical, but sample means rarely are. ANOVA asks whether the spread among those three means is larger than expected from ordinary within-group variation.
ANOVA definition
ANOVA means analysis of variance. It is a statistical test that compares the means of a numerical outcome across two or more groups, although it is most often introduced for three or more groups. In a one-way ANOVA, the groups are formed by one categorical independent variable, and the outcome is measured on a numerical scale.
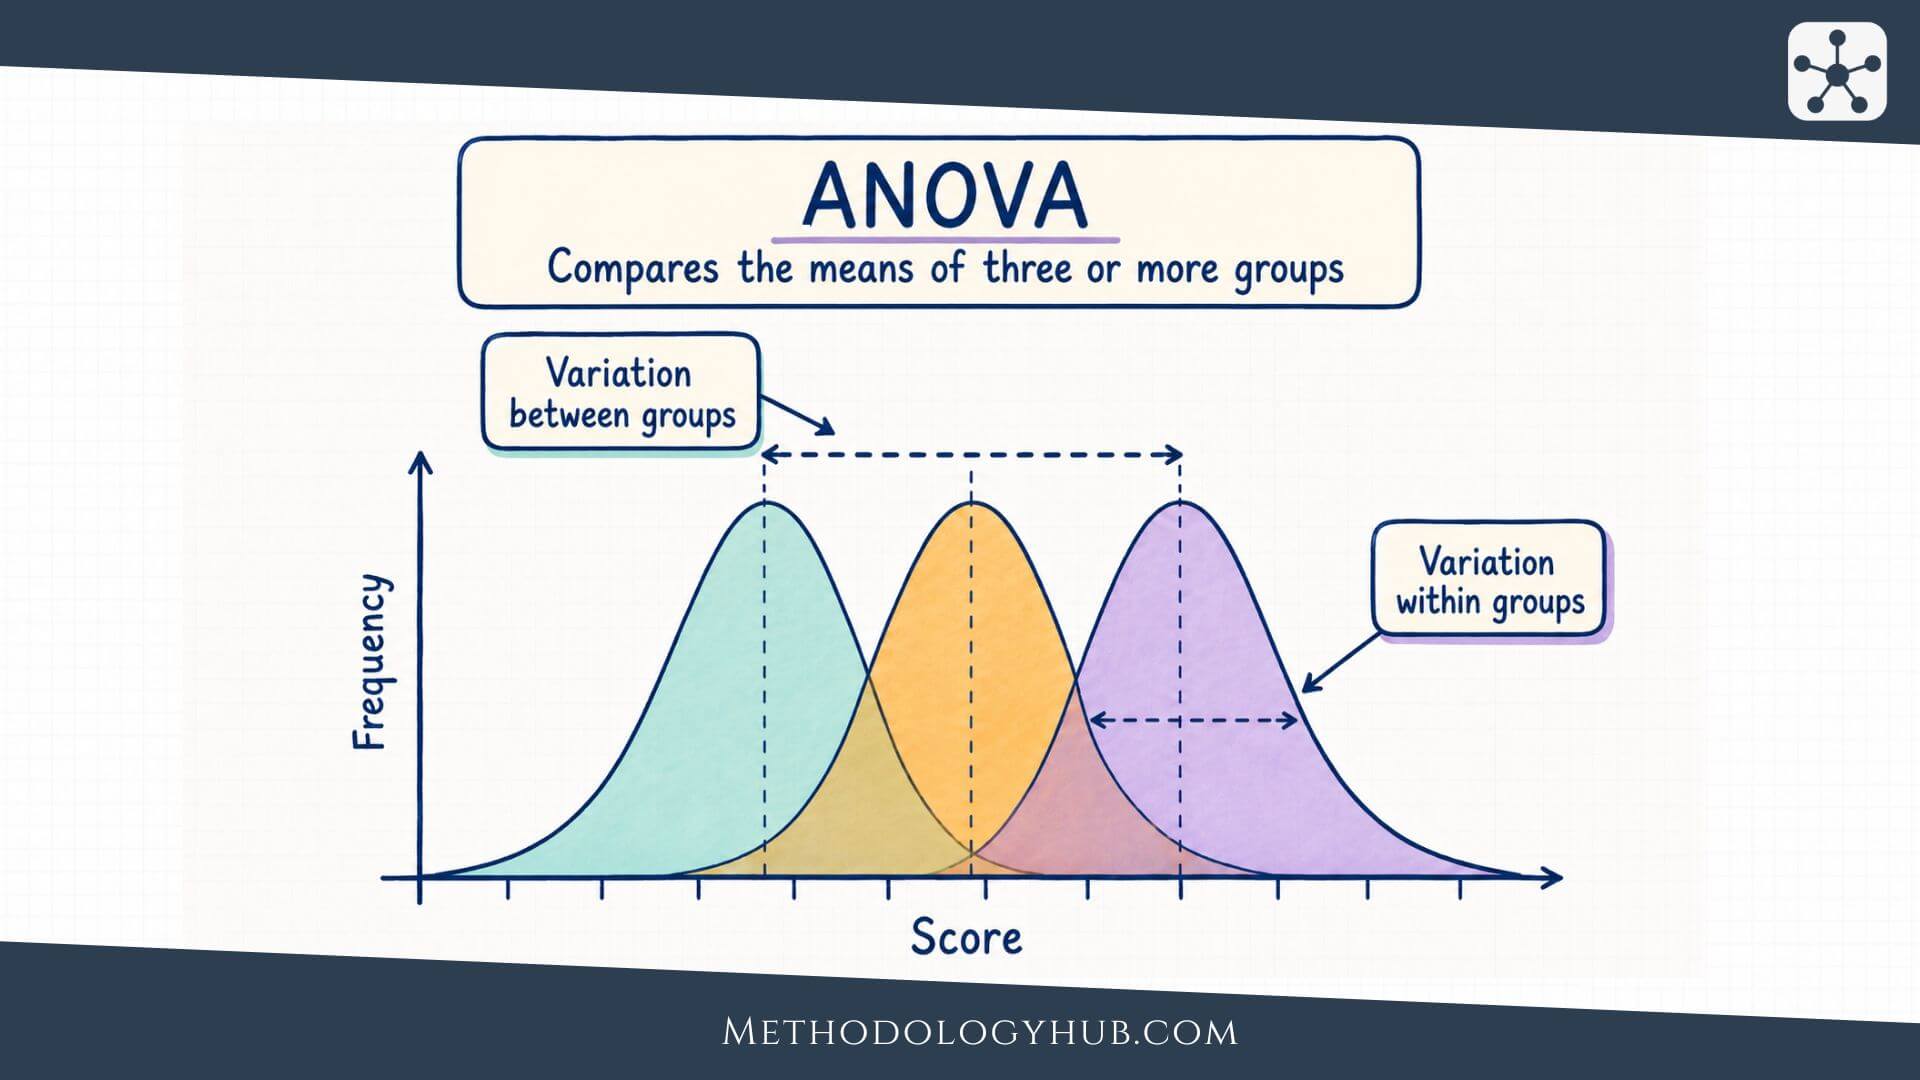
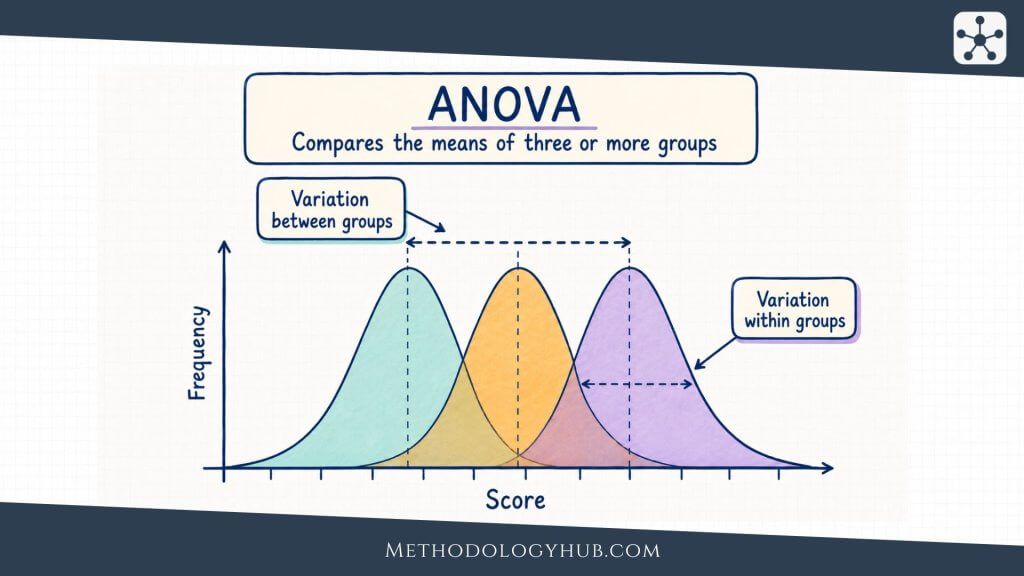
The name can feel slightly misleading at first. ANOVA is usually used to compare means, yet the calculation is based on variance. This is because the test compares two kinds of variability. It looks at how much the group means vary from one another, and it looks at how much individual scores vary inside their own groups.
ANOVA as part of hypothesis testing
ANOVA is a hypothesis test. The null hypothesis states that the population means are equal. In a one-way ANOVA with three teaching methods, the null hypothesis would say that the three population mean exam scores are the same.
The alternative hypothesis is broader than many beginners expect. It does not say that all groups differ from all other groups. It only says that at least one population mean differs from at least one other population mean. This is why a significant ANOVA result is often followed by post hoc comparisons or planned contrasts. The first test gives an overall answer. The follow-up comparisons help locate the differences.
How ANOVA differs from a t-test
A t-test is commonly used when the comparison involves one mean, two independent means, or two related means. ANOVA becomes useful when the comparison expands to several groups or several factors. In the three-method teaching example, using three separate t-tests would test lecture versus guided practice, lecture versus discussion, and guided practice versus discussion separately.
That approach may look simple, but it changes the error rate. Each test creates another chance of finding a statistically significant result by random variation alone. ANOVA avoids beginning with several separate pairwise tests. It first evaluates the whole set of means with one overall F test.
This does not mean ANOVA replaces the t-test in every setting. If the research question is about two independent groups, an independent-samples t-test may answer the question directly. If the question involves three or more group means, ANOVA usually gives a better starting point.
Key Aspects of ANOVA
ANOVA becomes easier to understand when the main pieces are read as parts of one comparison. A researcher has a numerical outcome, a grouping variable, and a question about mean differences. The test then separates the variation in the outcome into parts, compares those parts, and produces an F statistic and a p-value.
The ideas below often appear in ANOVA tables, software output, and research reports. They should not be memorised as isolated labels. They work together in the same calculation.
Dependent variable and factor
The dependent variable in ANOVA is the numerical outcome being compared across groups. It may be an exam score, response time, blood pressure reading, anxiety scale score, crop yield, or any other measured outcome where means are meaningful.
The factor is the categorical variable that defines the groups. In a one-way ANOVA, there is one factor, such as teaching method, treatment group, soil type, or age category. The categories of that factor are often called levels. A teaching-method factor with lecture, guided practice, and discussion has three levels.
Between-group variation
Between-group variation describes how far the group means are from the overall mean. If the group means are close together, the between-group variation is small. If one or more group means sit far away from the others, the between-group variation becomes larger.
This part of the calculation reflects the pattern the researcher is interested in. If teaching methods are associated with different average exam scores, the group means should show some separation. The test still needs to ask whether that separation is large enough after ordinary variation inside the groups is considered.
Within-group variation
Within-group variation describes how much individual scores vary around their own group mean. Even when students are taught with the same method, their scores will differ. Some students may have stronger prior knowledge. Others may be tired, anxious, or simply have different learning habits. This creates variation inside each group.
ANOVA uses within-group variation as the comparison background. If scores inside each group are very spread out, then a difference of a few points between group means may not be very surprising. If scores inside each group are tightly clustered, the same difference among group means may be more convincing.
Plain reading: ANOVA asks whether the distance among group means is large compared with the ordinary spread of scores inside the groups.
The F statistic
The F statistic is the main test statistic in ANOVA. It is formed by comparing a between-group estimate of variance with a within-group estimate of variance. In a simplified form, it can be read as:
Formula: F = mean square between groups / mean square within groups
If the null hypothesis is true and the group means differ only because of random sample variation, the two variance estimates should usually be similar. The F value will then be closer to 1. If the group means are separated more than the within-group variation would suggest, the F value becomes larger.
Degrees of freedom
ANOVA results include degrees of freedom. In a one-way ANOVA, the between-groups degrees of freedom are based on the number of groups. If there are k groups, the between-groups degrees of freedom are k – 1. The within-groups degrees of freedom are based on the total number of observations and the number of groups, usually N – k.
Degrees of freedom help determine the shape of the F distribution used to calculate the p-value. In a report, ANOVA is often written as F(df between, df within) = value, p = value. For example, F(2, 57) = 4.68, p = .013 means the analysis had 2 between-groups degrees of freedom and 57 within-groups degrees of freedom.
p-value and statistical significance
The p-value tells the researcher how unusual the observed F statistic would be if the null hypothesis of equal population means were true, assuming the model conditions are suitable. A small p-value suggests that the observed separation among group means is difficult to explain by within-group variation alone.
If the p-value is less than or equal to the chosen significance level, often .05, the null hypothesis is rejected. If the p-value is larger than the significance level, the researcher fails to reject the null hypothesis. That second result should be read carefully. It does not prove that all means are equal. It means the sample did not provide enough evidence for a difference under the test used.
Effect size
ANOVA should not be interpreted from the p-value alone. A statistically significant result may describe a small difference if the sample is large. A non-significant result may still be uncertain if the sample is small or the data are noisy.
Effect sizes help show how much of the outcome variation is associated with group membership. In ANOVA, common effect sizes include eta squared, partial eta squared, and omega squared. These values give a sense of the size of the group effect, although their interpretation depends on the research field, measurement quality, and design.
When to Use ANOVA
Use ANOVA when the research question asks whether mean values differ across groups. The outcome should be numerical, the groups should be formed by one or more categorical factors, and the design should match the version of ANOVA being used.
In academic research, ANOVA appears in education, psychology, biology, health research, agriculture, economics, sports science, and many other fields. The topic changes, but the structure stays familiar: one measured outcome is compared across group conditions.
Use ANOVA for three or more independent group means
The most common introductory use is a one-way ANOVA with three or more independent groups. For example, a researcher may compare mean reading scores across three instructional approaches, mean plant growth across four fertiliser types, or mean stress scores across three study schedules.
The word independent is important. It means the observations in one group are not naturally linked to observations in another group. If the same participants are measured repeatedly, or if observations are matched, the design is not an ordinary independent-groups one-way ANOVA.
Use ANOVA when one overall test should come before pairwise comparisons
ANOVA is useful when there are several groups and the researcher wants one initial test of the overall mean pattern. Instead of starting with many pairwise comparisons, ANOVA first asks whether the group means as a set show evidence of difference.
If that overall test is significant, the researcher may then use planned contrasts or post hoc tests. Planned contrasts are chosen before analysis because they match specific research expectations. Post hoc tests are often used after a significant overall ANOVA to examine which groups differ while controlling the error rate across comparisons.
Use ANOVA for factorial designs
ANOVA can also handle designs with more than one factor. A two-way ANOVA might compare exam scores by teaching method and school level at the same time. This allows the researcher to examine the main effect of teaching method, the main effect of school level, and the interaction between the two factors.
An interaction means that the difference among groups on one factor changes depending on the level of another factor. For example, one teaching method may work similarly across school levels, or it may be associated with higher scores only in older students. A factorial ANOVA is designed for this kind of question.
Use repeated measures ANOVA for related measurements
When the same participants are measured under several conditions or at several time points, a repeated measures ANOVA may be appropriate. For example, a researcher may measure anxiety before, immediately after, and four weeks after an intervention. The same people contribute several scores, so the observations are related.
Repeated measures ANOVA uses this related structure rather than treating the scores as independent. This can make the analysis more sensitive, but it also adds assumptions, such as attention to sphericity. If the repeated-measures structure is more complex, a mixed model may sometimes be a better choice.
When another test may fit better
ANOVA is not the right answer for every group comparison. If the outcome is categorical rather than numerical, a chi-square test or a model for categorical data may fit better. If the question concerns the association between two numerical variables, correlation tests or regression tests may be more direct.
If there are two independent groups and the outcome is numerical, an independent-samples t-test is usually enough. If the data are ordinal, strongly skewed, or dominated by unusual values, a rank-based method such as the Mann-Whitney U test or Kruskal-Wallis test may be considered, depending on the number of groups and the exact research question.
Assumptions
The assumptions of ANOVA connect the statistical test to the design and the data. They do not require a perfect dataset. They ask whether the F test gives a reasonable answer for the research question being asked.
Assumptions should be considered before the result is interpreted. Software can calculate an ANOVA table even when the design is unsuitable, but a printed F value does not make the analysis meaningful.
Numerical outcome variable
ANOVA assumes that the dependent variable is measured on a numerical scale where means are meaningful. Test scores, time values, height, weight, temperature, and multi-item scale scores are common examples.
When the outcome is a category, such as pass or fail, preferred study location, diagnosis group, or response option, ANOVA is usually not appropriate. The researcher should then consider methods for categorical outcomes or frequency tables instead of mean comparisons.
Independence of observations
Independence means that each observation contributes information that is not determined by another observation in the dataset. In an independent-groups ANOVA, one participant’s score should not be paired with, repeated from, or clustered tightly with another score unless the model accounts for that structure.
This assumption is often created or broken by the study design rather than by the calculation. If students are sampled from the same classrooms, patients from the same clinics, or measurements from the same person over time, ordinary one-way ANOVA may treat related observations as if they were unrelated. In such cases, repeated measures ANOVA, mixed models, or another design-specific method may be needed.
Approximate normality within groups
ANOVA is usually introduced with the assumption that the outcome is approximately normally distributed within each group, or that residuals from the model are approximately normal. In practice, the concern is not whether a formal normality test produces a perfect result. The more useful question is whether the distributional shape is reasonable enough for the planned inference.
Small samples with strong skew or extreme points can create problems. Larger samples are often more stable, especially when group sizes are similar. Visual checks, such as histograms, Q-Q plots, and residual plots, are usually more informative than relying only on one normality test.
Homogeneity of variances
Homogeneity of variances means that the groups have similar spread. If one group has much larger variability than the others, the standard one-way ANOVA can become less reliable, especially when group sizes are unequal.
Researchers often examine this assumption with side-by-side boxplots, group standard deviations, residual plots, or tests such as Levene’s test. If variances differ substantially, Welch’s ANOVA may be a better option for independent groups because it is designed to handle unequal variances more safely.
Practical check: ANOVA is usually more comfortable when group sizes are similar, group spreads are not very different, and no single extreme observation dominates the result.
Comparable measurement across groups
The same outcome should be measured in a comparable way across all groups. If one group takes a different test, uses a different scale, or is measured under very different conditions, a mean comparison may reflect measurement differences rather than group differences.
This point is easy to overlook because it is not always listed beside normality and equal variance. Still, it can shape the interpretation more strongly than a formal assumption test. ANOVA compares the numbers it receives. The researcher has to decide whether those numbers are comparable.
Assumptions in repeated measures ANOVA
Repeated measures ANOVA has additional assumptions because the same cases are measured more than once. One of the best-known is sphericity, which concerns the equality of variances of the differences between repeated conditions.
If sphericity is not reasonable, corrections such as Greenhouse-Geisser or Huynh-Feldt may be used. In more complex repeated or clustered designs, mixed models often give a more flexible way to handle correlation among observations.
Types of ANOVA
Several tests are called ANOVA because they share the same basic logic of comparing sources of variation. The right type depends on the number of factors, whether observations are independent or repeated, and whether the research question includes interactions.
For beginners, the easiest starting point is to identify the design. Count the factors, check whether the same cases are measured more than once, and decide whether the analysis should test one group difference, several group differences, or a pattern that depends on more than one factor.
One-way ANOVA
One-way ANOVA has one categorical factor and one numerical outcome. It tests whether the outcome mean differs across the levels of that factor. A researcher might compare mean exam scores across three study schedules, mean plant height across four soil treatments, or mean satisfaction scores across three course formats.
The name one-way does not mean there is only one group. It means there is one way of grouping the observations. If the factor has four levels, the one-way ANOVA compares four group means through one factor.
Two-way ANOVA
Two-way ANOVA includes two categorical factors and one numerical outcome. It can test the main effect of each factor and the interaction between them. For example, a study may compare exam scores by teaching method and year level.
The interaction is often the most interesting part of a two-way ANOVA. It asks whether the difference among teaching methods is the same across year levels. If the method difference is large in one year level and small in another, the interaction helps describe that pattern.
Factorial ANOVA
Factorial ANOVA is a broader term for ANOVA designs with two or more factors. A two-way ANOVA is the simplest factorial ANOVA. More complex designs may include three factors, although interpretation becomes harder as the number of factors increases.
Factorial designs are useful because many research situations involve more than one grouping variable. A biology study may consider treatment, species, and temperature condition. An education study may consider teaching method, school level, and prior achievement group. Factorial ANOVA lets the researcher examine these factors in one model rather than splitting the dataset into many separate tests.
Repeated measures ANOVA
Repeated measures ANOVA is used when the same participants, cases, or units are measured across several conditions or time points. Because the measurements are related, the analysis uses the within-person or within-unit structure instead of treating all observations as independent.
A simple repeated measures study may measure attention scores after three different classroom activities, with every student completing all three activities. The test then asks whether the mean attention score differs across activities while accounting for the fact that the same students appear in each condition.
Mixed ANOVA
Mixed ANOVA combines at least one between-subjects factor and at least one within-subjects factor. For example, a researcher may compare two teaching methods between groups and measure student performance at three time points within each group.
This design can examine whether scores change over time, whether the groups differ overall, and whether the pattern of change over time differs by group. That last question is often the interaction between time and group.
Welch’s ANOVA
Welch’s ANOVA is used for independent groups when the equal-variance assumption is not reasonable. It adjusts the test so that unequal group variances and unequal group sizes are handled more carefully than in the standard one-way ANOVA.
Researchers often consider Welch’s ANOVA when Levene’s test, group standard deviations, or plots suggest that group spreads are not similar. If Welch’s ANOVA is used, follow-up comparisons should also match that choice, such as Games-Howell comparisons rather than methods that assume equal variances.
| Type of ANOVA | Typical design | Question answered |
|---|---|---|
| One-way ANOVA | One factor, independent groups | Do mean outcomes differ across group levels? |
| Two-way ANOVA | Two factors, usually independent groups | Are there main effects or an interaction? |
| Repeated measures ANOVA | Same cases measured several times | Do means differ across related conditions or times? |
| Mixed ANOVA | Between-subjects and within-subjects factors | Does change over time differ between groups? |
| Welch’s ANOVA | Independent groups with unequal variances | Do means differ when equal variance is doubtful? |
Example usage
The following example uses a small education dataset to show how a one-way ANOVA is set up and interpreted. The numbers are simplified so that the logic is easy to follow. A real study would need a clear sampling plan, careful measurement, assumption checks, and a report that fits the research design.
Suppose a researcher wants to compare the mean exam scores of students taught with three different study-support formats. The outcome is exam score. The factor is support format, with three levels: self-study guide, guided worksheet, and peer discussion.
Research question
The research question asks whether mean exam scores differ across the three support formats. This is a mean comparison with one numerical outcome and one categorical factor, so a one-way ANOVA is a reasonable starting point if the observations are independent and the assumptions are suitable.
Hypotheses
The null hypothesis states that the population mean exam score is the same for all three support formats. Written in symbols, it can be shown as:
H0: μself-study = μworksheet = μdiscussion
The alternative hypothesis states that at least one population mean is different. It does not specify which one, and it does not say that every group differs from every other group.
Example data summary
The researcher collects exam scores from 60 students, with 20 students in each support format. The descriptive results are shown below.
| Support format | Sample size | Mean exam score | Standard deviation |
|---|---|---|---|
| Self-study guide | 20 | 72.4 | 8.1 |
| Guided worksheet | 20 | 76.9 | 7.6 |
| Peer discussion | 20 | 81.2 | 7.9 |
The means suggest a possible pattern. Students in the peer discussion group have the highest mean score, and students using the self-study guide have the lowest mean score. The ANOVA tests whether the overall separation among these means is large relative to the spread of scores within the groups.
ANOVA result
Suppose the software produces the following result:
Example result: F(2, 57) = 6.42, p = .003, η2 = .18
The p-value is below .05, so the researcher rejects the null hypothesis of equal means. The result suggests that mean exam scores are not the same across all three support formats. The effect size, eta squared = .18, suggests that a portion of the variation in exam scores is associated with support format in this sample.
Post hoc comparisons
The overall ANOVA does not tell the researcher which groups differ. For that, post hoc comparisons are needed. Suppose Tukey comparisons show that peer discussion differs significantly from self-study guide, while the other two pairwise differences are not statistically significant at the chosen level.
The interpretation would then be narrower than simply saying all methods differ. A better reading is that the overall ANOVA found evidence of a difference among the three means, and the follow-up comparisons suggested that the clearest difference was between peer discussion and self-study guide.
Writing the result in plain language
A plain report might say that mean exam scores differed across the three support formats, F(2, 57) = 6.42, p = .003, η2 = .18. Tukey follow-up comparisons indicated that the peer discussion group scored higher on average than the self-study guide group. The result should still be interpreted in relation to the study design, sampling method, and measurement quality.
This last sentence is not a formality. If students were not randomly assigned to formats, the group difference may reflect prior ability, motivation, teacher differences, or other variables. ANOVA can compare means, but the design determines how far the interpretation can go.
Interpretation of the ANOVA
Interpretation of the ANOVA begins with the research question, not with the p-value alone. The result should tell the reader what was compared, what the overall test showed, whether follow-up comparisons were used, and how large the group effect appears to be.
A good interpretation keeps the statistical decision and the study meaning connected. It does not overstate a significant result, and it does not treat a non-significant result as proof that all group means are equal.
Interpreting a significant ANOVA
A significant ANOVA means that the sample data provide evidence against the null hypothesis of equal population means. In plain language, the group means show more separation than would be expected from within-group variation alone under the null model.
The interpretation should still be careful. A significant one-way ANOVA tells us that at least one group mean differs. It does not tell us which group differs, how many groups differ, whether the difference is large in practical terms, or whether the design supports a causal claim. Those parts require descriptive statistics, effect size, confidence intervals, post hoc tests, and design reasoning.
Interpreting a non-significant ANOVA
A non-significant ANOVA means that the sample did not provide enough evidence to reject the null hypothesis at the chosen significance level. It does not prove that the group means are identical. The study may have had small differences, a small sample, noisy measurements, or wide uncertainty.
When results are non-significant, descriptive statistics and confidence intervals become especially useful. If the group means are very close and the confidence intervals are narrow, the result may suggest little difference in that setting. If the intervals are wide, the result may simply be uncertain.
Interpreting effect size
Effect size helps describe the magnitude of the group difference. Eta squared is often read as the proportion of total outcome variation associated with the group factor in the sample. Partial eta squared is common in factorial or repeated measures designs, but it should not be casually compared with eta squared from a simpler design.
Effect sizes need context. A small effect may still be important in some research settings if the outcome is difficult to change or the intervention is low-cost. A large effect may be less convincing if the sample is biased, the groups differ before the treatment, or the measurement is weak.
Interpreting post hoc tests
Post hoc tests examine pairwise group differences after the overall ANOVA. Common options include Tukey, Bonferroni, Holm, Games-Howell, and others. The choice depends on the design, variance assumptions, group sizes, and whether the comparisons were planned.
Post hoc results should be reported as follow-up evidence, not as disconnected findings. The reader should understand that the overall ANOVA tested the full set of means, and the follow-up comparisons helped interpret the pattern.
Interpreting interactions in factorial ANOVA
In a factorial ANOVA, interpretation often centres on interactions. If an interaction is present, the effect of one factor depends on the level of another factor. This can change the way main effects are read.
For example, suppose teaching method and school level are analysed together. If teaching method has a different pattern in lower and upper school levels, a single main effect of teaching method may hide part of the story. The researcher may need to describe the simple effects or plot the means to show how the pattern changes across levels.
Interpretation rule: Start with the design, then read the F test, then add effect size, group means, confidence intervals, and follow-up comparisons where needed.
Reporting ANOVA in academic writing
A basic ANOVA report usually includes the test name, factor, outcome, degrees of freedom, F statistic, p-value, effect size, and a short interpretation. If assumptions were checked or corrections were used, those should be noted. If post hoc tests were used, the method and main pairwise results should be stated.
A concise report may look like this:
Example: A one-way ANOVA showed a difference in mean exam scores across support formats, F(2, 57) = 6.42, p = .003, η2 = .18. Tukey comparisons indicated that the peer discussion group scored higher than the self-study guide group.
A fuller report would add the group means and standard deviations, the sample size per group, the confidence intervals for pairwise differences if available, and a short note about whether assumptions were considered. The goal is to make the result readable without forcing the reader to reconstruct the analysis from the software output.
ANOVA and Related Statistical Methods
ANOVA sits beside several other methods in statistical analysis. It is easiest to choose among them by looking at the outcome variable, the predictor variable, and the structure of the research question.
When the outcome is numerical and the predictor is categorical, ANOVA is often a natural option. When the variables or question change, another method may be more suitable.
ANOVA and regression
ANOVA and regression analysis are closely related. Both can be understood as part of the general linear model. In a one-way ANOVA, the predictor is categorical. In regression, predictors are often numerical, although categorical predictors can also be included with coding.
A regression model with categorical predictors can produce results equivalent to ANOVA in many simple designs. Regression becomes especially useful when the researcher wants to include numerical covariates, test trends, model prediction, or adjust for several predictors at once.
ANOVA and ANCOVA
ANCOVA, or analysis of covariance, combines ANOVA with regression-style adjustment. It compares group means while adjusting for one or more numerical covariates. For example, a researcher may compare post-test scores across teaching methods while adjusting for pre-test score.
This can be useful when groups differ at baseline or when a covariate is strongly related to the outcome. The interpretation depends on the design and assumptions, especially whether the relationship between the covariate and outcome is similar across groups.
ANOVA and correlation
ANOVA compares means across categories. Correlation analysis examines the association between variables, often two numerical variables. For example, a researcher asking whether study time is associated with exam score may use Pearson correlation if the relationship is roughly linear and the assumptions fit.
If the relationship is monotonic but not well described by a straight line, Spearman’s rank correlation may be more suitable. If the data are ordinal or based on ranks, Kendall’s tau may also be considered.
ANOVA and sampling
The quality of ANOVA interpretation depends partly on how the data were obtained. A clean F test cannot repair a weak sampling process. If the sample was selected through convenience sampling, the result may describe the sample well but support only cautious population claims.
Stronger population statements are usually easier to support when the study uses a suitable sampling design, such as random sampling, stratified sampling, or another planned approach described in the methods section. The statistical test and the sampling method should therefore be read together.
Conclusion
ANOVA is a statistical test for comparing mean outcomes across groups. Its central idea is simple: group means should be interpreted in relation to the variation inside the groups. When the means are separated more than the within-group spread would usually suggest, the F statistic becomes larger and the p-value may support rejecting the null hypothesis of equal population means.
The method is especially useful when a researcher compares three or more groups, works with factorial designs, or studies repeated measurements across several conditions. A significant result should be followed by careful interpretation. The researcher still needs to examine group means, effect sizes, assumptions, and, where appropriate, post hoc comparisons.
The clearest ANOVA reports do not turn the result into a stand-alone number. They explain what was compared, how the data were structured, what the F test showed, how large the effect appeared, and what the design allows the researcher to say. Used this way, ANOVA becomes a practical tool for reasoning from sample data without losing sight of uncertainty.
FAQs on ANOVA
What is ANOVA?
ANOVA, or analysis of variance, is a statistical test used to compare mean values across groups. It tests whether the group means differ more than expected from the variation within the groups.
When should I use ANOVA?
Use ANOVA when the outcome variable is numerical and the research question asks whether mean values differ across groups. A one-way ANOVA is commonly used for three or more independent groups.
What does a significant ANOVA result mean?
A significant ANOVA result means that the data provide evidence that not all population means are equal. It does not show which specific groups differ, so follow-up comparisons may be needed.
What are the main assumptions of ANOVA?
The main assumptions of ANOVA are a numerical outcome variable, independent observations for independent-groups designs, approximate normality within groups or residuals, and similar variances across groups.
What is the difference between ANOVA and a t-test?
A t-test is usually used for questions involving one mean, two independent means, or two related means. ANOVA is commonly used when comparing means across three or more groups or when the design includes several factors.


