
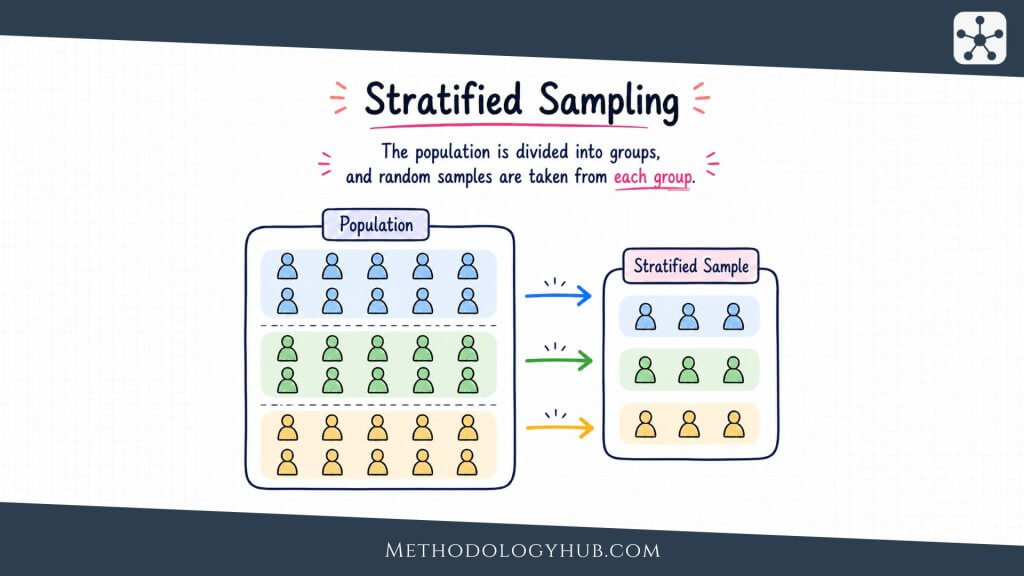
Stratified sampling is a probability-based sampling method in which a population is divided into meaningful subgroups before the sample is selected. These subgroups are called strata. Instead of drawing one sample from the whole population at once, the researcher draws a sample from each stratum, so that important groups are included in a planned way.
This article explains what stratified sampling is, how it works, which types are used, when it fits a study, how to carry it out, how it differs from other sampling methods, and how to report it in academic writing.
What Is Stratified Sampling?
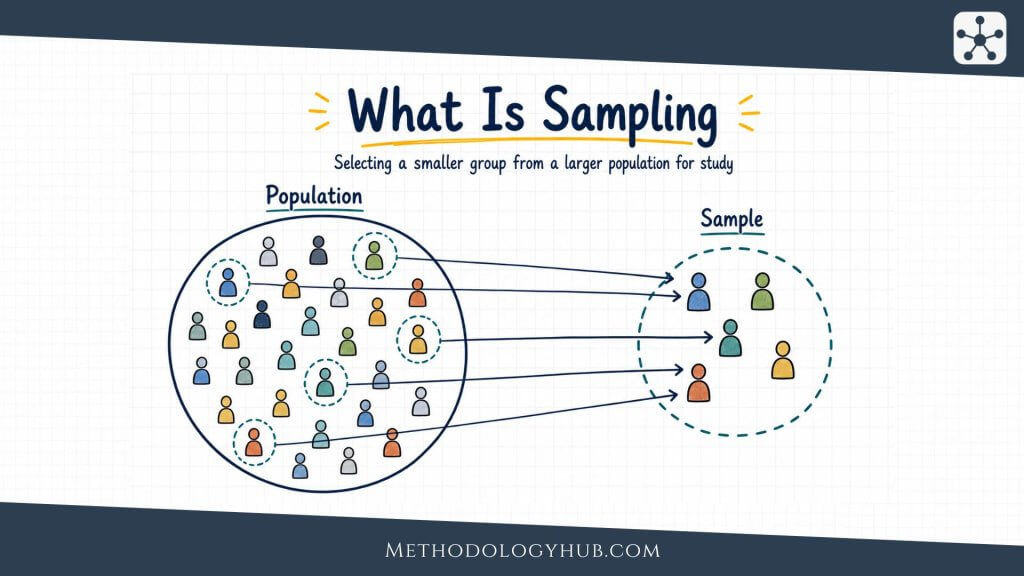
Stratified sampling is a probability sampling method that begins by dividing a population into separate subgroups. The researcher then selects a random sample from each subgroup. The purpose is not to split the population for its own sake. The purpose is to make sure that groups relevant to the research question are built into the sample from the start.
Suppose a researcher wants to study study habits among undergraduate students at a university. The population includes first-year, second-year, third-year, and final-year students. A simple random sample could work, but it might include too few final-year students by chance. A stratified sample would first divide the student list by year of study, then sample from each year group. The final sample would therefore contain students from every year group in a planned way.
Stratified sampling definition
Stratified sampling means dividing a defined population into non-overlapping strata and randomly selecting units from each stratum. A stratum is a subgroup formed before sampling begins, usually from a characteristic that is already known for all units in the sampling frame.
The strata should cover the whole population without overlap. Each unit should belong to one stratum and only one stratum. If a student can be counted in both the first-year group and the second-year group, the strata are not clear enough. If a clinic patient is left outside all diagnosis groups even though they belong to the target population, the strata are incomplete. Clear strata make the selection process easier to explain and the results easier to interpret.
Population, strata, and sampling frame
Stratified sampling begins with the same early decisions as other forms of sampling. The researcher defines the population, identifies the sampling frame, and decides which units can enter the study. What makes the design different is the extra step between the frame and the final sample. Before selection, the frame is sorted into strata.
For example, a district-wide education study may use a list of all schools as the sampling frame. If the research question concerns differences across school levels, the researcher may divide the frame into primary schools, lower secondary schools, and upper secondary schools. A random sample can then be drawn inside each level. The final sample still comes from the same population, but the route into the population is more controlled.
Stratified sampling and random selection
Stratified sampling is still a random method when the selection inside each stratum is random. The researcher may use simple random sampling within each stratum, or in some designs another probability procedure. What should not happen is choosing convenient cases inside each stratum and then calling the design stratified random sampling. Stratification controls the groups. Random selection controls how units are chosen within those groups.
This point helps separate stratified sampling from quota sampling. Both methods use categories. In quota sampling, the researcher may decide to recruit a set number of people from each category, but the people inside each category are usually selected through convenience or field access. In stratified sampling, the category step is followed by random selection. That difference affects the kinds of population claims the study can support.
Stratified sampling in research
In research, stratified sampling is often used when the population is not treated as one flat group. Students may differ by school level. Patients may differ by clinic type. Teachers may differ by subject area. Households may differ by region. Environmental observations may differ by habitat type. If those differences are related to the study question, stratification lets the researcher plan for them before data collection begins.
The method is especially useful in quantitative studies that estimate population values or compare planned subgroups. It can also support later statistical analysis, because the sampling design is visible and selection probabilities can be described.
How Stratified Sampling Works
Stratified sampling works by turning one large selection problem into several smaller ones. The researcher first decides which characteristic will define the strata. Then the sampling frame is divided according to that characteristic. After that, a sample is selected within each stratum and combined into one final sample.
The idea is easier to follow when the order is kept clear. Stratification comes before sampling. It is not a way of sorting participants after data have already been collected. If a researcher interviews 200 students and later notices that some are first-year students and others are final-year students, that is a subgroup description. It is not stratified sampling. In stratified sampling, the subgroup structure guides the selection process from the beginning.
Step from population to strata
The first design question is which strata should be used. Good strata are usually connected to the research question, the expected variation in the population, or the need for planned subgroup estimates. A study of reading support in schools may stratify by school level. A health service study may stratify by clinic type. A regional survey may stratify by geographic area.
The researcher also needs reliable information about the stratifying characteristic. If the sampling frame does not include year of study, then year of study cannot easily be used as the stratification variable. The researcher may need to update the frame, connect it to another data source, or choose a different design.
Sampling within each stratum
Once the strata are formed, the researcher selects cases from each one. In many introductory examples, simple random sampling is used within each stratum. Each eligible unit inside the stratum receives a number, and the required number of units is selected by a random number generator or another chance-based procedure.
This within-stratum selection should be documented. A reader should be able to see how many units were in each stratum, how many were selected, and how the selection was made. Without that detail, the label “stratified sampling” does not tell the reader enough about the design.
Planning note: Stratified sampling is strongest when the strata are chosen before data collection because they belong to the research question or the sampling plan.
Combining stratum samples
After the samples are drawn inside the strata, they are combined into the final sample. At this point, the researcher has one dataset, but it carries information about where each unit came from. That stratum label should usually remain in the data file because it may be needed for description, weighting, standard error calculation, or subgroup reporting.
A simple report might state that the study selected 100 students from each of four year groups. A fuller report would also show eligible counts, selected counts, response counts, and final analytic counts by stratum.
Proportionate and disproportionate allocation
The allocation is the rule for deciding how many units to select from each stratum. In proportionate stratified sampling, each stratum contributes to the sample in the same proportion that it contributes to the population. If 40% of the population is in one stratum, about 40% of the sample comes from that stratum.
In disproportionate stratified sampling, the sample does not follow the population proportions exactly. A small stratum may be sampled more heavily so that the researcher has enough cases to describe it or compare it with other strata. This can be useful, but it changes how population estimates should be calculated. If a small group is oversampled, the analysis may need weights so that the final estimate does not overstate that group’s share of the population.
Weights in stratified sampling
Weights are used when units in different strata have different probabilities of selection and the researcher wants an estimate for the whole population. The basic idea is simple: a unit that represents many population members receives more weight, while a unit from an oversampled group receives less weight.
For beginners, it is enough to remember that disproportionate sampling and weighting often belong together. Oversampling can improve subgroup analysis, but the final population estimate must respect the original population structure. This is one reason the sampling design should be recorded carefully rather than treated as a background detail.
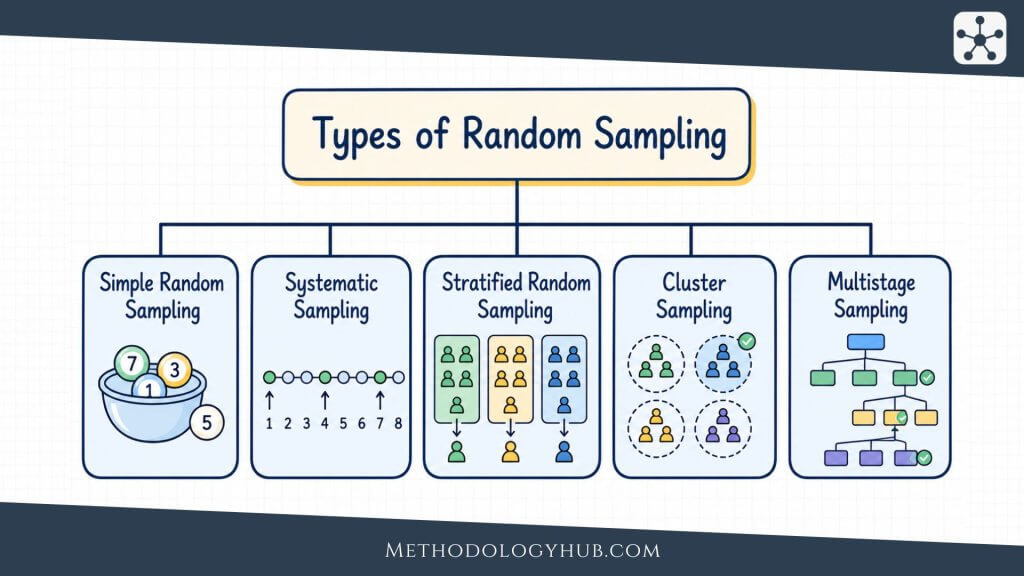
Types of Stratified Sampling
Stratified sampling is often introduced as one method, but several versions are used in research. The main difference is how the sample is allocated across strata. The researcher may follow population proportions, intentionally give more space to small groups, or allocate more cases to strata where measurements are more variable.
These choices should follow the purpose of the study. A survey that estimates one overall population percentage may use a different allocation from a study that compares several small groups.
Proportionate stratified sampling
Proportionate stratified sampling keeps the sample distribution close to the population distribution. If 50% of the population is in Stratum A, 30% is in Stratum B, and 20% is in Stratum C, then a sample of 500 would include about 250 from A, 150 from B, and 100 from C.
This version is easy to explain and often works well when the study wants an overall estimate for the population. It can also make the sample look familiar to readers because the group shares match the population shares. Its limitation appears when a small stratum is too small for separate analysis. If a group is only 3% of the population, a proportionate sample of 300 would include only about 9 cases from that group.
Disproportionate stratified sampling
Disproportionate stratified sampling selects some strata at a higher or lower rate than their population share. The most common reason is to give small groups enough observations for analysis. A researcher studying student support may oversample students in a small programme so that their responses can be examined with more stability.
This does not mean the final sample is wrong. It means the sample was designed for more than one purpose. It may support subgroup comparison better than a proportionate design, while requiring more care for population estimates. The researcher should therefore report both the population distribution and the sample distribution, so the reader can see how the design was built.
Equal allocation
Equal allocation gives the same sample size to each stratum. If there are four strata and the researcher wants 400 participants, each stratum receives 100 sample slots. This is a form of disproportionate stratified sampling unless the strata are all the same size in the population.
Equal allocation is sometimes useful when the main goal is to compare strata. For example, a study may compare four school levels and need enough cases in each level. The method gives a clear design, but it can produce a sample that differs strongly from the population. For overall estimates, weights may be needed.
Optimal allocation
Optimal allocation distributes the sample across strata by considering population size, variability, and sometimes cost. More cases may be assigned to larger strata, to strata with more variation, or to strata where data collection is cheaper. In survey sampling, this can improve the precision of estimates when good prior information exists.
For students and early research projects, optimal allocation is usually less common than proportionate or equal allocation because it requires more information before sampling begins.
Stratified random sampling
The phrase stratified random sampling is often used when the researcher wants to make clear that random selection occurs inside the strata. In many research methods texts, stratified sampling and stratified random sampling are used almost interchangeably, especially when the method is introduced as a probability sampling design.
| Type | How allocation works | Good fit |
|---|---|---|
| Proportionate stratified sampling | Each stratum appears in the sample in about the same proportion as in the population. | Overall population estimates and balanced representation. |
| Disproportionate stratified sampling | Some strata are sampled more or less heavily than their population share. | Small groups, planned comparisons, and subgroup estimates. |
| Equal allocation | The same number of units is selected from each stratum. | Direct comparison between strata. |
| Optimal allocation | Sample sizes reflect stratum size, variability, and sometimes data collection cost. | Precision-focused survey designs with good prior information. |
When Stratified Sampling Fits a Study
Stratified sampling fits studies where the population contains groups that should not be left to chance. This does not mean every subgroup in a population needs its own stratum. Too many strata can make the design difficult to manage. The question is whether a characteristic is important enough to shape selection before data collection begins.
A good use of stratified sampling usually has three features: the population can be divided clearly, the stratifying information is available before sampling, and the groups are relevant to the research question or planned interpretation.
Use it for planned subgroup representation
Stratified sampling is useful when the researcher wants certain groups to appear in the sample in planned numbers. A simple random sample may include those groups, but it does not guarantee useful counts for each one. Stratification removes some of that uncertainty by sampling from each group separately.
For example, a researcher studying the use of academic support services may want to describe students from different year groups. If final-year students are a small part of the population, a simple random sample might include too few of them. Stratified sampling lets the researcher decide how many final-year students should be invited before selection begins.
Use it when groups differ in relevant ways
Stratification is most useful when the strata differ in ways connected to the outcome or interpretation. If pupils in different school levels have different reading patterns, school level is a sensible stratifying variable. If clinics have different service models, clinic type may be useful. If regions differ in access, region may help the sample reflect those differences.
By contrast, a stratum that has no connection to the study can add work without adding much value. A survey about laboratory equipment access may not benefit from stratifying by eye colour, even if that information is available. The strata should help the study answer its question more clearly.
Use it when estimates need more precision
Stratified sampling can improve precision when units inside each stratum are more similar to one another than units in the population as a whole. If the strata are well chosen, the within-stratum estimates may be less variable. The final population estimate can then be more precise than an estimate from an equally sized simple random sample.
This is one reason stratified sampling is common in surveys and monitoring studies. A researcher may want a sample that looks balanced and estimates with smaller standard errors. That connection between design and uncertainty is part of the link between stratified sampling and inferential statistics.
Use another approach when strata are unclear
Stratified sampling is not always suitable. If the population cannot be divided into clear and non-overlapping groups, the design may become confusing. If the sampling frame does not contain the stratifying information, the researcher may not be able to assign units to strata before selection. If the study is qualitative and needs people with a specific experience rather than a population estimate, purposive sampling may fit better.
Other sampling methods may also be more practical. Cluster sampling can work better when the population is spread across schools, clinics, neighbourhoods, or other natural groups and a direct list of individuals is unavailable. Systematic sampling may be easier when a complete ordered list exists and subgroup control is not central.
How to Use Stratified Sampling
Using stratified sampling well requires more than dividing a list into categories. The researcher has to define the population, check the frame, choose the strata, decide how many units to sample from each stratum, apply a random procedure, and report the design clearly. Each step affects what the final sample can support.
Step 1: Define the target population
The target population is the full group the study wants to describe. It should be specific enough that the reader can tell who is included. “Teachers” is too broad for most studies. “Full-time secondary school mathematics teachers in District X during the 2026 school year” is clearer.
A precise population definition also helps the researcher choose strata, such as school type, teaching experience, or region.
Step 2: Identify the sampling frame
The sampling frame is the list, register, database, map, roster, or other practical route used for selection. In a university study, it may be an enrolment list. In a health records study, it may be a patient registry. In an environmental study, it may be a map of sampling sites.
The frame needs to include the stratifying variable. If this information is missing or outdated, the researcher needs to update the frame or choose a different design.
Step 3: Choose the stratifying variable
The stratifying variable is the characteristic used to form the strata. It may be a demographic characteristic, location, institution type, grade level, diagnosis category, programme type, or another variable known before sampling. It should help the sample reflect the population or support the analysis.
The researcher should avoid creating too many strata. A small number of meaningful strata is often easier to implement and easier for readers to understand.
Step 4: Decide the allocation
After the strata are defined, the researcher decides how many units to select from each one. This is where the design becomes proportionate, disproportionate, equal, or optimal. The allocation should match the intended analysis.
If the main goal is an overall population estimate, proportionate allocation may be suitable. If the study needs to compare small strata, equal or disproportionate allocation may be better. If the study has good prior information and a precision-focused design, optimal allocation may be considered.
Step 5: Select units randomly within each stratum
Within each stratum, the researcher uses a random procedure to select the required number of units. This may involve a random number generator, statistical software, or a reproducible sampling function. The selection should not be adjusted informally because a case looks easier to contact or more interesting.
If selected units cannot be contacted or are not eligible after checking, the researcher should follow a planned replacement or follow-up rule.
Step 6: Contact selected units and track response
After selection, the researcher contacts the selected people, institutions, records, or sites according to the data collection plan. This step belongs to data collection, but it also affects sampling quality. A carefully selected sample can still be weakened if response differs strongly by stratum.
Response tracking should therefore be done by stratum. If one stratum has a much lower response rate, the final dataset may not reflect the planned design.
Step 7: Analyse according to the design
Analysis should respect how the sample was selected. In a proportionate design with similar response across strata, the analysis may be straightforward. In a disproportionate design, weights may be needed for population estimates. In complex survey work, standard errors may need to account for stratification, weights, and other design features.
This is especially important when the study uses hypothesis testing, correlation analysis, or regression analysis beyond the observed sample.
Step 8: Report the sampling procedure
A clear report names the population, frame, strata, allocation rule, random selection method, response pattern, and final analytic sample. It should also state whether weights were used. If weights were not used in a disproportionate design, the researcher should explain what kind of claim the analysis supports.
The goal is to let readers see the path from population to sample, including whether the design was proportionate and whether selection inside strata was random.
Stratified Sampling Example
A worked example can make the design easier to see. Imagine a researcher studying access to academic feedback among undergraduate students at one university. The population is all 10,000 undergraduate students enrolled in the current academic year. The researcher expects feedback access to differ by year of study, so year group is chosen as the stratifying variable.
The university list shows four year groups. The researcher wants a sample of 500 students. If proportionate stratified sampling is used, each year group contributes to the sample in the same proportion as it appears in the population.
| Year group | Population size | Population share | Proportionate sample |
|---|---|---|---|
| First year | 3,500 | 35% | 175 |
| Second year | 3,000 | 30% | 150 |
| Third year | 2,500 | 25% | 125 |
| Final year | 1,000 | 10% | 50 |
Reading the example
In the proportionate design, final-year students make up 10% of the population and 10% of the sample. This is useful if the researcher mainly wants an overall estimate for the university and also wants each year group represented in the correct population share.
However, 50 final-year students may be too few if the researcher wants a detailed comparison between year groups. The researcher may then choose a disproportionate design, such as 125 students from each year group. The total sample would still be 500, but final-year students would be intentionally oversampled.
Example interpretation: Proportionate sampling mirrors the population. Equal allocation gives each year group the same sample size for comparison.
How the example changes with disproportionate sampling
If the researcher selects 125 students from each year group, the final sample gives equal space to all four groups. This can make comparisons easier, especially if the same survey questions are analysed separately by year. But the sample no longer reflects the population distribution. Final-year students are 10% of the population but 25% of the sample.
That difference is not a flaw if it was planned and reported. It simply means that overall population estimates should usually be weighted. Without weights, the overall estimate would give final-year students more influence than they have in the population. For subgroup comparisons, the equal sample sizes may be exactly what the study needs.
What to report from the example
A clear methods section for this example could say that the population was divided into four strata by year of study. It could report the number of eligible students in each stratum, the number randomly selected from each stratum, the number who responded, and whether weights were applied in overall estimates.
This style of reporting is useful because it separates the design from the result. The reader can see that year group was selected as a stratifying variable before sampling, that the selection inside each year group was random, and that the final analysis considered the allocation.
Stratified Sampling vs Other Sampling Methods
Stratified sampling is easiest to understand when it is compared with nearby methods. It belongs to the probability sampling family, but it does not work like every other probability method. It also resembles some non-probability methods on the surface, especially when those methods use categories.
The main question is where chance enters the design and what the researcher is trying to control. Stratified sampling controls subgroup representation by sampling inside each subgroup. Other methods solve different practical problems.
Stratified sampling vs simple random sampling
In simple random sampling, units are selected directly from the full sampling frame. Every unit has the same chance of being chosen. This method is clear and efficient when the population is fairly uniform or when subgroup counts are not central to the study.
Stratified sampling adds a grouping step. The researcher divides the frame into strata and samples within each one. This is useful when groups should appear in planned numbers or when stratification can improve precision. The trade-off is added planning. The researcher needs reliable stratum information before selection.
Stratified sampling vs cluster sampling
Stratified sampling and cluster sampling both divide a population, but they do it for different reasons. In stratified sampling, the researcher usually wants every stratum represented. In cluster sampling, the researcher randomly selects some groups, often because sampling every individual directly would be expensive or impractical.
A school study shows the difference. If the researcher divides schools into primary, lower secondary, and upper secondary levels and samples from each level, the design is stratified. If the researcher randomly selects a set of schools and then studies pupils inside those selected schools, the design is cluster sampling or a multistage design.
Stratified sampling vs systematic sampling
Systematic sampling selects every kth unit from an ordered list after a random start. It is often practical with long lists because the researcher does not need to generate many separate random numbers. The method spreads selection across the frame.
Stratified sampling vs quota sampling
Quota sampling also uses categories and target numbers. A researcher may decide to recruit a certain number of participants by age group, region, or school level. The difference is that quota sampling usually does not randomly select participants within those categories. Recruitment often depends on availability, access, or interviewer choice.
This difference is important. A quota sample may give visible category coverage, but it does not usually provide the same probability basis as stratified sampling. When a study needs population estimates with sampling uncertainty, stratified random selection offers a stronger design.
| Method | Main selection idea | How it differs from stratified sampling |
|---|---|---|
| Simple random sampling | Selects directly from the full frame. | Does not require planned subgroup selection. |
| Cluster sampling | Selects groups first. | Usually selects some clusters, while stratified sampling samples from every stratum. |
| Systematic sampling | Selects every kth unit after a random start. | Uses interval selection rather than subgroup allocation. |
| Quota sampling | Fills category targets without random selection. | Has category control but usually lacks probability selection inside categories. |
Advantages of Stratified Sampling
Stratified sampling has several advantages when the population contains meaningful subgroups. Its strength is that it includes those groups through a planned sampling procedure that can be reported, inspected, and linked to later analysis.
It improves planned subgroup representation
The most direct advantage is subgroup representation. In a simple random sample, small groups may appear in small numbers or may even be missed in a very small sample. Stratified sampling reduces that risk because the researcher selects from each stratum separately.
This is useful when subgroup presence affects interpretation. A study of school experiences may need pupils from different school levels. A health service study may need patients from different clinic types. A study of academic progress may need students from different years of study. Stratified sampling lets the researcher build that coverage into the design.
It can improve precision
When strata are chosen well, stratified sampling can produce more precise estimates than a simple random sample of the same size. This often happens when units inside a stratum are relatively similar and strata differ from one another. The design then reduces some of the variation that would otherwise appear inside one undivided sample.
Precision is not automatic. A poorly chosen stratifying variable may add little. If the strata are not related to the outcome or if there is high variation inside every stratum, the design may not improve much. The benefit depends on the match between the strata and the study variables.
It supports clear comparison between strata
Stratified sampling can be useful when comparison between groups is part of the analysis. If the researcher wants to compare year groups, regions, school levels, or clinic types, the design can ensure that each group has enough cases for a basic comparison.
This advantage is strongest when the allocation is chosen for comparison. Equal allocation or intentional oversampling can give small groups enough observations. The researcher should then be clear about whether the analysis is focused on subgroup comparison, overall population estimation, or both.
It makes the sampling plan more transparent
A stratified sampling plan can be described in a way that helps readers understand the route from population to data. The researcher can state the population, strata, stratum sizes, allocation rule, random selection method, response by stratum, and weighting approach. That makes the design easier to evaluate.
Limitations of Stratified Sampling
Stratified sampling is useful, but it is not always simple. The same features that make it powerful can also make it demanding. The researcher needs information before sampling begins, needs enough cases in each stratum, and needs an analysis that matches the design.
It needs reliable stratum information
The method depends on knowing which stratum each unit belongs to before selection. If that information is missing, outdated, or inconsistent, the design can be difficult to apply. A university list with incorrect programme information, for example, can put students in the wrong strata.
The problem is more than a technical inconvenience. If the strata are wrong, the final sample may not represent the intended groups. The researcher should therefore check the quality of the frame before relying on it for stratification.
It can become complex with too many strata
Too many strata can make the design hard to manage. If a researcher stratifies by region, school type, year level, and gender all at once, the number of stratum combinations can grow quickly. Some cells may contain only a few eligible units or none at all.
A simpler design is often better. The researcher should choose strata that serve the study directly. Extra categories can still be described later if the sample supports it, but they do not all need to control selection.
Small strata can be difficult to sample
Very small strata create practical problems. If a stratum has only a small number of eligible units, the researcher may need to sample a large share of it or include all units from that stratum. This can increase contact work and may still produce limited data if response is low.
Weights and design-aware analysis may be needed
Disproportionate stratified sampling can support subgroup analysis, but it often requires weights for overall population estimates. Without weights, oversampled strata can have too much influence on the result. For complex designs, standard errors may also need to account for stratification and unequal selection probabilities.
This does not make the method unsuitable. It simply means that the analysis should not ignore the sampling design. A beautifully planned sample can still be misread if the final analysis treats it as if it were a simple random sample.
It can still be weakened by non-response
Random selection within strata does not guarantee equal response. One stratum may have a much lower response rate than another. If the final sample differs from the selected sample, the original design may lose some of its intended balance.
Researchers should track response by stratum and report it when possible. Follow-up can sometimes reduce the problem. Weighting or response adjustment may also help, depending on the study design and available information. What should be avoided is reporting only the planned stratified design while hiding a very uneven final response pattern.
How to Report Stratified Sampling
Reporting stratified sampling clearly helps readers judge the link between the sample and the population. A short label is not enough. The reader needs to know how the strata were formed, how many units were selected from each stratum, and how the final analysis handled the design.
This is especially important when the paper reports population estimates, subgroup comparisons, confidence intervals, or statistical tests.
What to include in the methods section
A useful methods section usually includes the target population, sampling frame, stratifying variable, stratum sizes, allocation rule, random selection procedure, response rates, exclusions, final sample sizes, and weighting approach.
A concise report might read: “The population was divided into four strata by year of study. Within each stratum, students were selected using a computer-generated random sample from the enrolment list. The sample was proportionate to the number of students in each year group.” A fuller report would add counts and response rates.
How to describe the allocation
The allocation should be named directly. If the sample followed population proportions, say that the design used proportionate stratified sampling. If small groups were oversampled, say that the design used disproportionate stratified sampling and explain the reason.
The report should also state whether weights were used, especially if small strata were oversampled and the study reports overall population estimates.
How to connect reporting with variables and analysis
Strata are often based on a known characteristic, but that characteristic may also appear later as a study variable. For example, year of study can be a stratifying variable and also a grouping variable in analysis. The report should make that dual role clear.
If the study analyses relationships between variables, the sampling design still belongs in the interpretation. This is relevant for methods such as Pearson correlation, Spearman’s rank correlation, or regression models used with survey data.
Example reporting sentence
Here is a plain example of how the method can be reported:
The study used proportionate stratified random sampling. The sampling frame was divided by year of study, and students were randomly selected within each year group in proportion to that group’s share of the undergraduate population.
For a disproportionate design, the wording should change. The researcher might write that final-year students were oversampled to support year-group comparisons and that population estimates were weighted to restore the population distribution. That one sentence prevents a great deal of confusion later in the results section.
Conclusion
Stratified sampling gives researchers a structured way to select a sample when a population contains groups that should be represented deliberately. Its central idea is simple: divide the population into clear strata, then randomly sample within each stratum. That extra grouping step can make the sample more useful than one drawn from the whole frame at once.
The method is especially helpful when the study needs planned subgroup representation, subgroup comparison, or more precise population estimates. It can be proportionate, disproportionate, equal allocation, or optimally allocated, depending on the purpose of the study. Those choices should be made before data collection and explained in the methods section.
Stratified sampling also requires care. The population must be defined, the sampling frame must contain reliable stratum information, the allocation must match the research purpose, and the analysis must respect the design. When these pieces are kept together, stratified sampling gives a clear route from a diverse population to a sample that can support careful interpretation.
FAQs on Stratified Sampling
What is stratified sampling?
Stratified sampling is a probability sampling method in which a population is divided into non-overlapping subgroups, called strata, and a random sample is selected from each stratum.
What is an example of stratified sampling?
An example is a university study that divides students by year of study and then randomly selects students from each year group. This ensures that first-year, second-year, third-year, and final-year students are included in planned numbers.
What are strata in stratified sampling?
Strata are the subgroups used to divide the population before sampling. They should be clear, non-overlapping, and relevant to the research question or sampling plan.
What is the difference between proportionate and disproportionate stratified sampling?
In proportionate stratified sampling, each stratum appears in the sample in the same proportion as in the population. In disproportionate stratified sampling, some strata are sampled more or less heavily, often so that small groups have enough cases for analysis.
When should researchers use stratified sampling?
Researchers should use stratified sampling when the population contains meaningful subgroups that should be represented in planned numbers, or when well-chosen strata can improve the precision of population estimates.
How is stratified sampling different from cluster sampling?
Stratified sampling divides the population into strata and usually samples from every stratum. Cluster sampling randomly selects groups, such as schools or clinics, and then collects data from all or some units inside the selected groups.
What are the limitations of stratified sampling?
Stratified sampling needs reliable information about each unit before selection, can become complex with many strata, may require weights in disproportionate designs, and can still be weakened by uneven non-response.


