Mann-Whitney U test is a rank-based statistical test used to compare two independent groups when the outcome is ordinal, not normally distributed, or better analysed through ranks than through raw means. It is often introduced as a nonparametric alternative to the independent-samples t-test, although that comparison should be handled carefully because the two tests do not always answer the same question.
This article explains what the Mann-Whitney U test is, how it works, which assumptions need attention, when to use it, how to calculate it in a simple example, how to interpret the result, and how to report it in academic writing.
What Is the Mann-Whitney U Test?
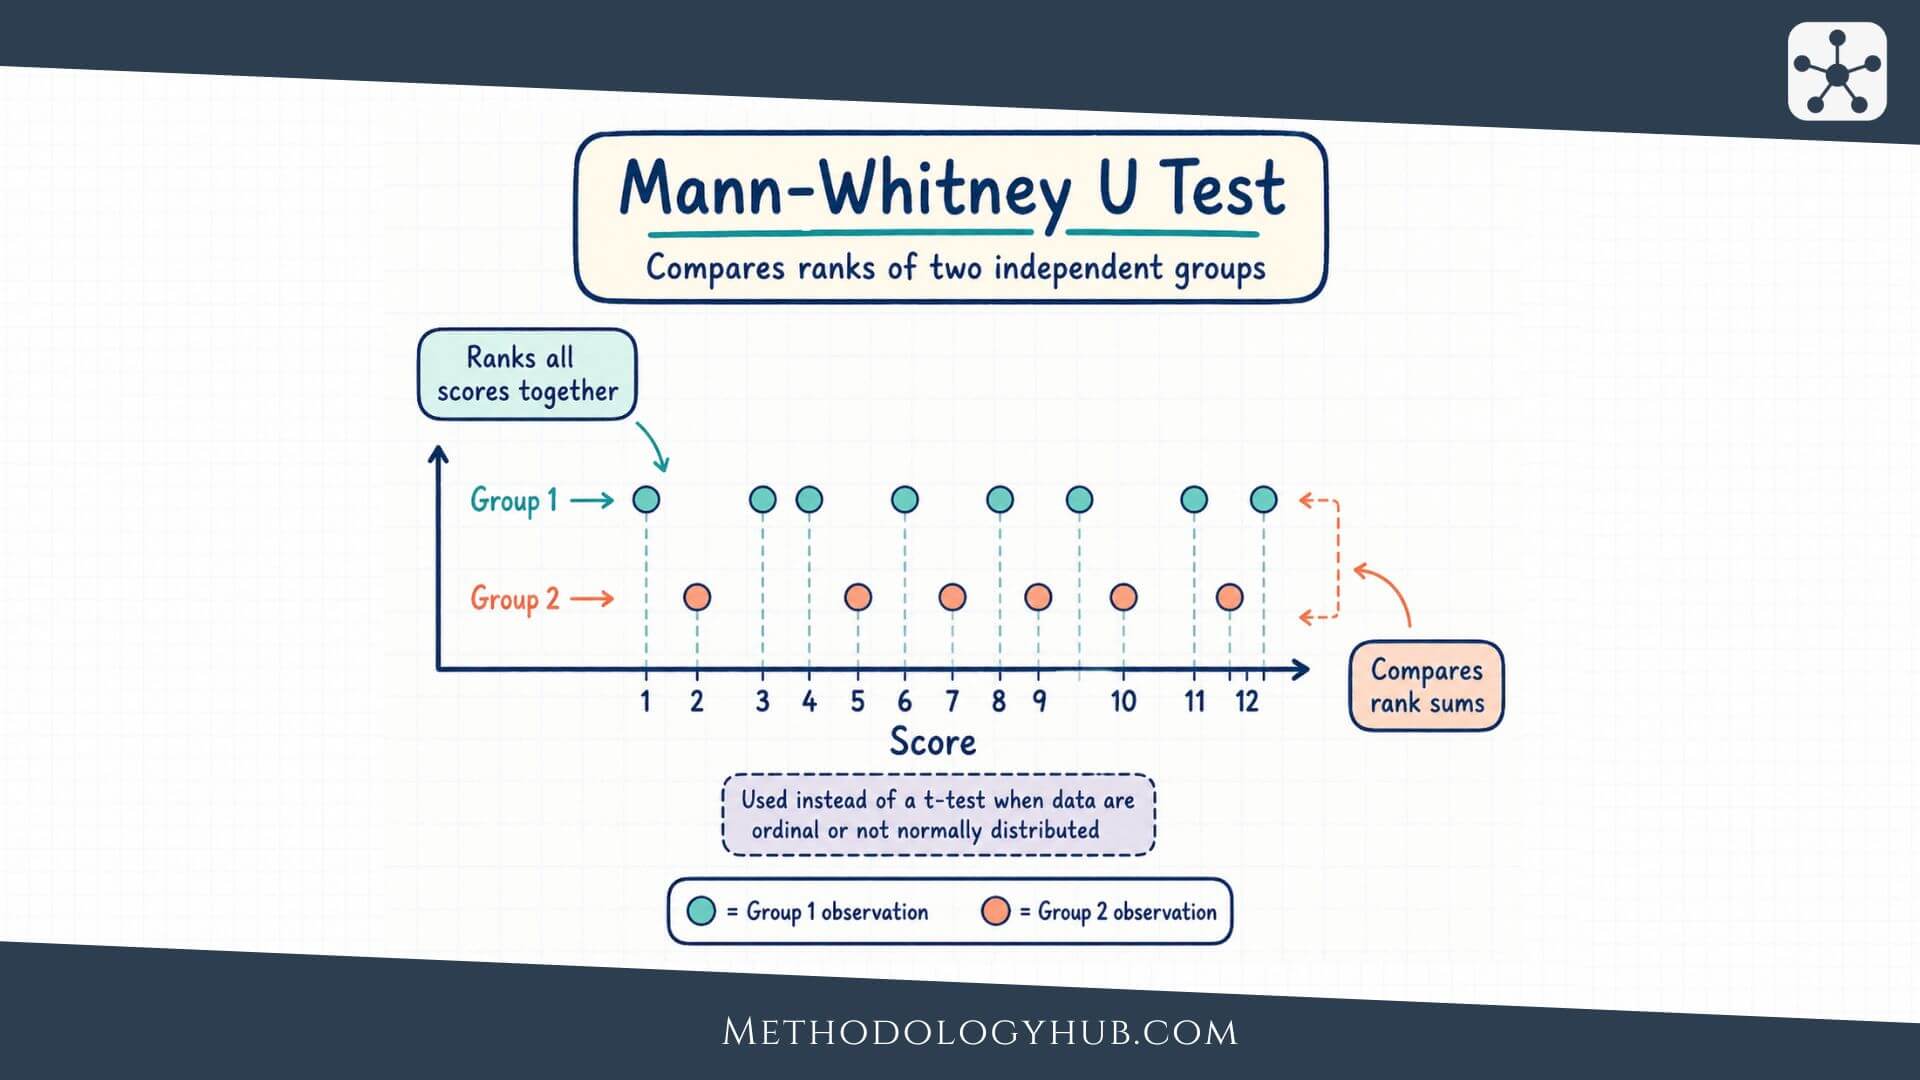
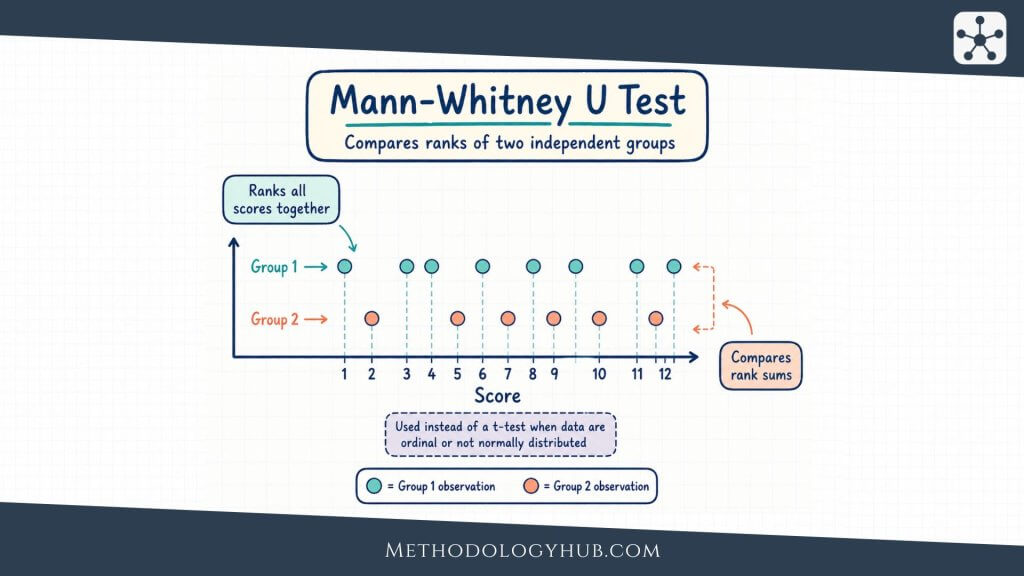
The Mann-Whitney U test is a nonparametric test for comparing two independent groups. Instead of comparing group means directly, it combines the observations from both groups, ranks them from lowest to highest, and then examines whether the ranks tend to be higher in one group than in the other.
That rank-based idea is the centre of the test. Imagine a researcher compares writing anxiety scores from students who used two different revision methods. If the scores in one group usually receive higher ranks than the scores in the other group, the Mann-Whitney U test helps judge whether that rank difference is larger than would be expected from random sample variation alone.
Mann-Whitney U test definition
The Mann-Whitney U test is a statistical test that evaluates whether two independent samples come from the same distribution, or whether values in one group tend to be larger or smaller than values in the other group. It is used when the outcome is at least ordinal and when a rank-based comparison fits the research question.
In many introductory courses, the test is described as a test of median difference. That can be a useful shortcut only under certain conditions. If the two groups have distributions with a similar shape and spread, a difference in ranks can often be read as a difference in typical position, such as a median difference. If the shapes or spreads differ, the test may instead reflect a broader difference between distributions.
What the U statistic represents
The U statistic is connected to pairwise comparisons between the two groups. In plain terms, it counts how often a value from one group outranks a value from the other group, with tied pairs handled by assigning half a point to each side. When the groups are very similar, the wins and losses are more balanced. When one group tends to have higher values, its U value reflects that pattern.
This pairwise reading is helpful because it gives the test an intuitive meaning. The test is not asking whether the arithmetic averages are equal. It is asking whether the ordering of observations suggests that one group tends to sit higher or lower than the other.
Different names for the same test family
You may see the Mann-Whitney U test called the Wilcoxon rank-sum test, the Mann-Whitney-Wilcoxon test, or the Wilcoxon-Mann-Whitney test. These names are closely related and often refer to equivalent rank-based procedures for two independent samples. Software may use one name while textbooks use another.
The naming difference can confuse beginners, especially when software output reports a Wilcoxon W statistic rather than a U statistic. The underlying comparison is usually the same two-sample rank comparison. What changes is the statistic displayed and the way the software labels the output.
Key Aspects of the Mann-Whitney U Test
The Mann-Whitney U test is easiest to understand when its main parts are kept together. The test begins with two independent groups, changes the raw data into ranks, compares the rank totals, and then uses the U statistic to judge whether the observed rank pattern is unusual under the null hypothesis.
This flow is different from a mean-based comparison. A very large value still receives a high rank, but its exact distance from the next value does not dominate the calculation. That is one reason the test can be useful when data include skewed values or ordinal ratings.
Rank-based comparison
In the Mann-Whitney U test, all observations from both groups are placed into one ordered list. The smallest value receives rank 1, the next smallest receives rank 2, and so on. If two or more values are tied, they receive the average of the ranks they would have occupied.
After ranking, the ranks are returned to their original groups and added. A group with generally higher observations will usually have a higher sum of ranks. The test then converts those rank sums into the U statistic.
Two independent groups
The test is designed for two independent groups. Independent means that the observations in one group are not matched, repeated, paired, or naturally linked with observations in the other group. A comparison of two different classes, two different treatment groups, or two unrelated participant groups may fit this structure.
If the same participants are measured twice, or if each participant in one group is matched with a participant in another group, the data are not independent in the usual two-sample sense. In that case, a paired rank-based test, such as the Wilcoxon signed-rank test, is usually more suitable.
Null and alternative hypotheses
The null hypothesis usually states that the two groups have the same distribution, or that an observation from one group is just as likely to be higher as an observation from the other group. The alternative hypothesis states that the distributions differ, or that values from one group tend to be higher or lower.
The alternative can be two-sided or one-sided. A two-sided test asks whether the groups differ in either direction. A one-sided test asks whether one specified group tends to have higher values than the other. The direction should come from the research question before the result is calculated.
Formula: U1 = R1 – n1(n1 + 1) / 2, where R1 is the sum of ranks in group 1 and n1 is the size of group 1.
p-value and significance level
After U is calculated, it is compared with the distribution expected under the null hypothesis. Small samples are often handled with an exact p-value. Larger samples are often handled with a normal approximation, sometimes with a correction for ties and sometimes with a continuity correction, depending on the software and method.
The p-value is interpreted in the usual hypothesis testing way. If the p-value is less than or equal to the chosen significance level, often 0.05, the researcher rejects the null hypothesis. If it is larger, the researcher does not reject the null hypothesis.
Effect size
A p-value alone does not show how large the group difference is. For the Mann-Whitney U test, researchers may report an effect size such as rank-biserial correlation, Cliff’s delta, or a standardised z-based effect size. The choice depends on field norms and software output.
A simple effect-size reading asks how often values from one group are higher than values from the other group. This keeps the interpretation close to the rank-based nature of the test. It also helps readers understand the result without treating statistical significance as the full answer.
Assumptions
The assumptions of the Mann-Whitney U test are not as demanding as those of many parametric tests, but they still deserve careful attention. The test does not require normally distributed data. It does, however, require a data structure that fits a two-group rank comparison.
Assumptions are best checked before the test is interpreted. A result can be calculated even when the design does not fit well, but a calculated result is not automatically a useful answer. The goal is to decide whether the test matches the research question and the data.
Independent observations
Each observation should be independent of the others. One student’s score should not determine another student’s score. One patient’s measurement should not be repeated as if it came from a new patient. One household, classroom, laboratory batch, or matched pair should not be treated as separate unrelated cases if the design links them.
Independence is mostly a design issue. It cannot be repaired by ranking the data. If observations are clustered, repeated, or matched, the analysis may need a different method or a version of the test designed for that structure.
Two independent groups
The Mann-Whitney U test compares exactly two independent groups. If the research question involves three or more independent groups, a rank-based method such as the Kruskal-Wallis test is usually considered instead. If the question involves one group measured at two time points, a paired method is needed.
This group structure should be checked before the outcome variable is examined. Two columns in a spreadsheet do not automatically mean two independent groups. The researcher should know how the observations were generated and whether any natural pairing exists.
Ordinal or continuous outcome
The outcome should be at least ordinal. This means the values can be ordered from lower to higher in a meaningful way. Exam scores, response times, symptom ratings, Likert-type scale totals, income bands, and ordered performance ratings may fit this requirement, depending on the research context.
Nominal categories do not fit the test because they have no natural order. For example, subject area, blood type, or preferred study location would usually need a different method. If the research question is about association between categories, a chi-square test may be more suitable.
Similar shapes for a median interpretation
The Mann-Whitney U test can detect differences in distribution. If the two distributions have a similar shape and spread, a rank difference is often interpreted as a difference in central tendency. In that setting, researchers may describe the result in terms of medians.
If one group is much more spread out, strongly skewed, or shaped differently from the other, a median-only interpretation can be too narrow. The test may be responding to differences in spread, shape, or the probability that one group produces larger values. A boxplot or violin plot often helps the reader see what the rank test is picking up.
Ties and sample size
Ties occur when several observations have the same value. They are common with rating scales, rounded measurements, short tests, and ordered categories. The Mann-Whitney U test can handle ties, but software may use a tie correction when calculating the p-value.
Sample size also affects how the p-value is obtained. With small samples, exact methods are often preferred when available. With larger samples, software may use a normal approximation. In a report, it is useful to state whether the p-value was exact or asymptotic when the distinction is relevant.
When to Use the Mann-Whitney U test
Use the Mann-Whitney U test when the research question compares two independent groups on an outcome that can be ranked. The test is especially helpful when the outcome is ordinal or when a numerical outcome is skewed, contains unusual values, or does not fit a mean-based comparison well.
A good starting question is simple: do the values in one group tend to be higher or lower than the values in another independent group? If the answer is yes, and the outcome can be ordered, the Mann-Whitney U test may fit the analysis.
Use it for two independent groups
The most direct use is a comparison between two separate groups. An education researcher may compare motivation ratings between students in two teaching formats. A psychology researcher may compare stress scores between two independent participant groups. A health researcher may compare symptom severity ratings between two treatment groups.
The examples are different, but the structure is the same. There is one outcome, two independent groups, and a question about whether the values tend to be higher in one group than the other.
Use it for ordinal outcomes
Ordinal outcomes have a meaningful order, but the distances between categories may not be equal. Satisfaction ratings, symptom severity categories, agreement scales, and ranked performance levels can often be analysed with a rank-based method when the comparison involves two independent groups.
The test does not require the researcher to pretend that the distance between “strongly disagree” and “disagree” is exactly the same as the distance between “agree” and “strongly agree.” It uses order rather than equal intervals as the basis of the comparison.
Use it when numerical data are not suitable for a t-test
The independent-samples t-test compares group means and works best when its assumptions are reasonable. If the outcome is strongly skewed, has extreme values, or is measured on a scale where means are not the best summary, the Mann-Whitney U test may provide a better fit.
This does not mean the Mann-Whitney U test should be chosen automatically whenever a normality test is significant. Large samples can make normality tests sensitive to small departures. Small samples can make them weak. The researcher should look at the data, the design, and the research question together.
| Research situation | Better-fitting test | Reason |
|---|---|---|
| Two independent groups, ordinal outcome | Mann-Whitney U test | The outcome can be ranked. |
| Two independent groups, numerical outcome, assumptions suitable | Independent-samples t-test | The question focuses on means. |
| Three or more independent groups | Kruskal-Wallis test or ANOVA | The design has more than two groups. |
| Two related measurements | Wilcoxon signed-rank test or paired t-test | The data are paired or repeated. |
| Two categorical variables | Chi-square test | The data are counts in categories. |
Use it as part of a wider analysis plan
The Mann-Whitney U test answers one focused question. It does not adjust for several predictors, model repeated observations, or explain a causal process by itself. If the research question includes several explanatory variables, a suitable modelling approach may be needed instead, such as regression analysis or another design-specific method.
For a simple two-group comparison, however, the test is often clear and useful. It lets the researcher compare group position without relying on means or normal distributions.
Compared with Other Statistical Tests
The Mann-Whitney U test sits within a family of methods used for comparing groups. It becomes easier to choose when it is placed beside the tests it is often confused with. The difference is not only the name of the test. It is the structure of the data and the kind of claim the researcher wants to make.
Most selection problems can be solved by asking three questions. How many groups are being compared. Are the groups independent or related. Is the outcome numerical, ordinal, or categorical. Once these are clear, the test choice usually becomes much less mysterious.
Mann-Whitney U test and independent-samples t-test
Both tests are often used for two independent groups, but they do not treat the outcome in the same way. The independent-samples t-test compares means. It is most suitable when the outcome is numerical and the assumptions behind a mean comparison are reasonable.
The Mann-Whitney U test compares ranks. It is more suitable when the outcome is ordinal or when the numerical values are not well represented by a mean. If the research question is specifically about average score and the data support a mean-based analysis, the t-test may be a clearer choice. If the question is about ordered position or distributional difference, the Mann-Whitney U test may be better.
Mann-Whitney U test and Wilcoxon signed-rank test
The Mann-Whitney U test is for independent groups. The Wilcoxon signed-rank test is for paired or related measurements. This distinction is more important than the fact that both tests use ranks.
For example, if two different groups of students receive two different study resources, the groups are independent. If the same students are measured before and after using one study resource, the measurements are paired. The first situation may fit the Mann-Whitney U test. The second may fit the Wilcoxon signed-rank test.
Mann-Whitney U test and Kruskal-Wallis test
The Kruskal-Wallis test can be thought of as a rank-based method for comparing three or more independent groups. It is often used when the outcome can be ranked and the design has more than two groups. A study comparing ratings across three teaching formats would usually move beyond the Mann-Whitney U test.
If a Kruskal-Wallis test is statistically significant, follow-up comparisons may examine which groups differ. Those follow-up comparisons need care because several tests can increase the chance of false positive findings if they are not handled properly.
Mann-Whitney U test and correlation tests
The Mann-Whitney U test compares groups. Correlation tests examine association between variables. A study comparing anxiety scores between two independent groups may use a Mann-Whitney U test. A study examining whether anxiety score rises with number of absences may use a correlation test.
If both variables are ordinal or the relationship is monotonic rather than linear, Spearman’s rank correlation may be appropriate. If the relationship is linear between two quantitative variables and assumptions are suitable, Pearson correlation may fit better.
How the Mann-Whitney U Test Is Calculated
The calculation behind the Mann-Whitney U test is manageable once the data are ranked. Software is normally used in research, but a small hand calculation shows what the test is doing. The calculation moves from raw values to ranks, from ranks to rank sums, and from rank sums to U.
The steps below use the usual rank-sum formula. Some software reports a Wilcoxon W statistic instead. That statistic is closely related to the rank sum, and it can be converted to U. The interpretation remains a comparison of two independent groups.
Step 1: Combine the observations
Begin by placing values from both groups into one list. Keep track of which group each value came from, because the ranks will later be returned to their groups.
For example, if group A has five values and group B has five values, the combined list contains ten observations. The smallest value receives the lowest rank and the largest value receives the highest rank.
Step 2: Rank the values
Rank all observations from lowest to highest. If there are ties, use the average rank for each tied value. This is the same ranking logic used in several rank-based methods.
Ranking reduces the influence of exact distances between values. A value of 90 is higher than a value of 80, but the test works with their positions in the ordered list rather than the raw 10-point difference.
Step 3: Add the ranks within each group
Once all observations have ranks, add the ranks for group A and add the ranks for group B. These rank sums are the basis for the U statistic. The group with generally higher values will tend to have a higher rank sum.
The total of all ranks can also be checked. If there are N total observations, the ranks should add to N(N + 1) / 2. With ten observations, the ranks from 1 to 10 add to 55.
Step 4: Calculate U for each group
For group 1, the statistic can be calculated as:
Group 1 formula:
U1 = R1 – n1(n1 + 1) / 2
R1 is the sum of ranks in group 1, and n1 is the number of observations in group 1.
A matching U value can be calculated for group 2. The two U values add to n1 x n2. Many hand-calculation tables use the smaller U value for significance testing. Software usually handles this automatically.
Step 5: Find the p-value
The final step is to find the p-value. For small samples, exact probabilities can be calculated from the possible rank arrangements under the null hypothesis. For larger samples, the U statistic can be standardised and compared with the normal distribution.
Software may also adjust for ties, especially when many observations share the same value. This is one reason hand calculations are useful for learning but software is preferred for real datasets.
Example usage
A worked example can make the Mann-Whitney U test easier to follow. Suppose an education researcher compares short quiz scores from two independent groups of students. Group A used a standard lesson. Group B used the same lesson with additional guided practice. The researcher wants to know whether the quiz scores tend to be higher in one group than the other.
The example is intentionally small so the calculation can be seen. A real study would need a clearer sampling plan, a larger sample when possible, and a full check of the design and assumptions.
| Group A score | Group B score |
|---|---|
| 62 | 70 |
| 68 | 74 |
| 71 | 78 |
| 75 | 82 |
| 77 | 88 |
Step 1: State the hypotheses
The null hypothesis states that the two groups have the same distribution of quiz scores. The two-sided alternative states that the distributions differ. If the researcher had specified in advance that guided practice should produce higher scores, a one-sided alternative could be considered, but this example uses a two-sided test.
- H0: The quiz score distributions are the same in the two groups.
- Ha: The quiz score distributions are different in the two groups.
Step 2: Rank all scores together
The ten scores are combined and ranked from lowest to highest. There are no ties in this example, so the ranks are simply 1 through 10.
| Score | Group | Rank |
|---|---|---|
| 62 | A | 1 |
| 68 | A | 2 |
| 70 | B | 3 |
| 71 | A | 4 |
| 74 | B | 5 |
| 75 | A | 6 |
| 77 | A | 7 |
| 78 | B | 8 |
| 82 | B | 9 |
| 88 | B | 10 |
Step 3: Add the ranks and calculate U
Group A has ranks 1, 2, 4, 6, and 7. The rank sum for group A is therefore 20. Group B has the remaining ranks 3, 5, 8, 9, and 10, giving a rank sum of 35.
Group A calculation:
UA = 20 – 5(5 + 1) / 2
UA = 20 – 15
UA = 5
Because nA x nB = 25, the other U value is 25 – 5 = 20. The smaller U value is 5. Using an exact two-sided Mann-Whitney U test for this small example gives p = .151.
Step 4: Interpret the example
The guided-practice group has higher ranks overall, and its median score is also higher. However, with only five students in each group, the exact two-sided p-value is .151. At a significance level of .05, the result is not statistically significant.
A careful interpretation would say that the sample showed higher quiz scores in the guided-practice group, but the Mann-Whitney U test did not provide enough evidence to reject the null hypothesis in this small example. That wording keeps the observed pattern and the statistical decision separate.
Interpretation of the Mann-Whitney U Test
Interpretation of the Mann-Whitney U test should begin with the research question, not the p-value alone. The p-value tells the reader whether the rank pattern is unusual under the null hypothesis. The direction, size, distribution shape, and study design tell the reader what that result means in context.
A clean interpretation usually includes four parts: the direction of the rank difference, the statistical decision, the size of the effect if available, and a sentence that ties the result back to the study design.
Statistical significance
A statistically significant Mann-Whitney U test means that the observed rank pattern would be unlikely under the null hypothesis at the chosen significance level. If p = .03 and alpha is .05, the researcher rejects the null hypothesis.
This does not prove that every value in one group is higher than every value in the other group. It also does not automatically prove a causal effect. It means the rank evidence is strong enough, under the chosen test conditions, to reject the null hypothesis.
Direction of the difference
The direction is usually read from the rank sums, medians, or descriptive summaries. If group B has higher ranks and a higher median, the researcher may say that scores tended to be higher in group B, provided the data support that reading.
Direction should be written in terms of the variables, not only in statistical labels. Instead of writing only “the test was significant,” explain which group tended to have higher values and what the outcome represented.
Effect size and practical size
Effect size helps the reader understand the size of the group difference. A small p-value can occur with a small effect in a very large sample, while a noticeable sample difference may not reach statistical significance in a small sample. Both situations are possible.
Rank-biserial correlation and Cliff’s delta are often useful because they match the rank-based logic of the test. A z-based effect size may also appear in software output. Whichever effect size is chosen, the report should explain it in plain language when the audience includes readers who may not use that statistic often.
Median and distribution language
If the two distributions have similar shape and spread, it may be reasonable to say that one group had a higher median than the other. If the distributions differ strongly in shape or spread, it is safer to describe the result as a difference in distributions or rank positions.
A plot can help here. Boxplots, dot plots, or violin plots can show whether one group is simply shifted higher, whether one group is more spread out, or whether the pattern is driven by only a few observations. That visual check often makes the written interpretation more accurate.
Non-significant results
A non-significant Mann-Whitney U test does not prove that the two groups are identical. It means the sample did not provide enough evidence to reject the null hypothesis under the chosen test and assumptions.
The sample size, effect size, and confidence interval all help the reader judge the result. In small studies, a non-significant result may be uncertain rather than clearly absent. In larger studies, a small non-significant effect may support a more cautious conclusion about limited evidence for a difference.
How to Report the Mann-Whitney U Test
Reporting the Mann-Whitney U test should give the reader enough information to understand the comparison without guessing how the analysis was done. At minimum, the report should name the two groups, describe the outcome, give the U statistic, provide the p-value, and state the direction of the result.
When space allows, it is also useful to include group medians or mean ranks, sample sizes, the effect size, and whether an exact or asymptotic p-value was used. These details make the result easier to check and easier to compare with other studies.
Basic reporting format
A concise report may look like this:
Example: Quiz scores tended to be higher in the guided-practice group than in the standard-lesson group, but the difference was not statistically significant, U = 5.00, p = .151, two-sided exact test.
This sentence gives the result and keeps the interpretation restrained. It reports the observed direction, the statistical decision, the test statistic, the p-value, and the test direction. A fuller report would add sample sizes, medians, and an effect size.
What to include in a fuller report
A fuller report might include the following information: group medians, sample sizes, U, p-value, effect size, and a short note about the distribution shapes if median language is used. The exact details depend on the discipline, journal style, and purpose of the analysis.
For example: “The guided-practice group had a higher median quiz score (Mdn = 78) than the standard-lesson group (Mdn = 71). A two-sided exact Mann-Whitney U test did not show a statistically significant difference, U = 5.00, p = .151, nA = 5, nB = 5.” If an effect size is calculated, it can be added after the p-value.
Reporting software output
Different software may report different labels. R may report W for the Wilcoxon rank-sum test. SPSS may report U, mean ranks, and a standardised test statistic. Python, Jamovi, Stata, and other tools may provide exact or asymptotic p-values depending on settings.
Do not copy output without translating it into the research context. A table may contain the statistic, but the text should still explain what was compared and what the result suggests. Readers should not have to infer the meaning from software labels alone.
Wording for significant and non-significant results
For a significant result, use wording such as “scores tended to be higher in group B” or “group B had higher ranks than group A.” For a non-significant result, use wording such as “the test did not provide enough evidence of a difference.” Avoid saying that the groups were proven equal unless an equivalence design was actually used.
The best reporting style is usually simple. Name the groups, name the outcome, report the statistic, and explain the result in one or two clear sentences.
Conclusion
The Mann-Whitney U test is a useful rank-based method for comparing two independent groups. It is especially suitable when the outcome is ordinal or when a numerical outcome is better understood through ordered position than through raw means. The test ranks all observations together and then examines whether one group tends to have higher ranks than the other.
The test is flexible, but it is not assumption-free. The observations should be independent, the groups should be independent, and the outcome should be orderable. If the researcher wants to interpret the result as a median difference, the group distributions should have similar shapes and spreads. If that condition is not reasonable, distributional or rank-position language is safer.
A strong report combines the statistic with interpretation. U and p-value tell part of the story. Direction, effect size, sample size, plots, assumptions, and design complete the interpretation. When those pieces are kept together, the Mann-Whitney U test gives a clear way to reason from two-group sample data without forcing the analysis into a mean-based framework.
FAQs on Mann-Whitney U Test
What is the Mann-Whitney U test?
The Mann-Whitney U test is a nonparametric statistical test used to compare two independent groups. It ranks all observations from both groups together and tests whether values in one group tend to receive higher ranks than values in the other group.
When should I use the Mann-Whitney U test?
Use the Mann-Whitney U test when you have two independent groups and an outcome that can be ranked. It is often used for ordinal outcomes, skewed numerical outcomes, or situations where a rank-based comparison is more suitable than a mean-based comparison.
Is the Mann-Whitney U test the same as a t-test?
No. The independent-samples t-test compares group means, while the Mann-Whitney U test compares rank positions between two independent groups. The two tests may be used in similar two-group settings, but they do not always answer the same statistical question.
What are the assumptions of the Mann-Whitney U test?
The main assumptions are independent observations, two independent groups, and an outcome that is at least ordinal. If the result is interpreted as a median difference, the two group distributions should also have broadly similar shapes and spreads.
How do I interpret a significant Mann-Whitney U test?
A significant Mann-Whitney U test means that the rank pattern differs more than expected under the null hypothesis. Interpret the result by naming which group had higher ranks, reporting the p-value and effect size, and checking whether median or distributional language best fits the data.


