Statistical tests are procedures used in statistical analysis to examine whether patterns in sample data are strong enough to support a research claim. A study may find that one class has a higher average score than another, that two survey answers seem connected, or that a new teaching approach is followed by better results. A statistical test helps the researcher ask whether that pattern is likely to reflect more than ordinary sample variation.
This article explains what statistical tests are, how they work, how common tests differ, how parametric and non-parametric tests are chosen, which assumptions need attention, and how results should be interpreted in academic research.
What Are Statistical Tests?
Statistical tests are formal methods for comparing observed data with what would be expected under a statistical assumption. The assumption may be that two group means are equal, that two categorical variables are independent, that a population correlation is zero, or that a regression coefficient has no association with the outcome. The test turns the sample data into a test statistic and, in many cases, a p-value.
The point of a test is not to make data look more technical. It is to handle uncertainty in a consistent way. Samples vary even when nothing meaningful has changed in the population. Two small groups may have different averages simply because different people happened to be included. A statistical test asks whether the observed difference, association, or pattern is large enough relative to the variation in the data.
Statistical tests definition
Statistical tests are procedures that use sample data, probability, and assumptions about the data structure to evaluate a claim about a population or process. They are commonly used to compare means, compare proportions or counts, test relationships between variables, or examine coefficients in a model.
A researcher may use a t-test to compare two means, a chi-square test to examine categorical counts, or regression tests to evaluate coefficients in a model. These tests do not answer the same question. The name of the test should therefore follow the research question and the type of data, not the other way around.

Statistical tests and hypothesis testing
Most statistical tests appear inside the wider process of hypothesis testing. The researcher begins with a null hypothesis and an alternative hypothesis. The null hypothesis usually gives the reference claim, such as no difference, no association, or equality with a stated value. The alternative hypothesis describes the pattern that would receive support if the data give enough evidence against the null hypothesis.
The statistical test provides the calculation used to evaluate that evidence. In a t-test, the calculation produces a t statistic. In ANOVA, it produces an F statistic. In a chi-square test, it produces a chi-square statistic. The test statistic is then interpreted using a reference distribution, which leads to a p-value or a comparison with a critical value.
What a statistical test can show
A statistical test can show whether the observed data are difficult to reconcile with a stated null hypothesis. It can also help the researcher use a transparent decision rule, such as rejecting the null hypothesis when the p-value is less than or equal to the chosen significance level.
Still, the test result is only one part of the interpretation. A small p-value does not prove that a theory is true, and a large p-value does not prove that no difference or association exists. The quality of the data collection, the sampling approach, the measurement process, the assumptions of the method, and the size of the observed effect all shape the final reading.
Key Aspects of Statistical Tests
The central parts of statistical tests are easier to understand when they are seen as one chain of reasoning. A researcher starts with a question, identifies the variables, states what would be expected under a null hypothesis, chooses a test that matches the data, and then interprets the result in relation to the original question.
For example, imagine a researcher comparing reading scores between students taught with two different lesson formats. The outcome variable is a reading score. The group variable is lesson format. The statistical question is whether the mean score differs between the two groups in the population, rather than appearing only in this sample. A suitable test then has to reflect that structure.
Research question and variable type
The research question comes first because it tells the researcher what kind of pattern is being examined. A question about average scores points toward a test for means. A question about category counts points toward a categorical test. A question about two numerical variables moving together points toward a correlation test or regression model.
The type of variable then narrows the choice. Numerical variables, such as scores, times, ages, or scale totals, can often be analysed with t-tests, ANOVA, correlation, or regression. Categorical variables, such as group membership or response categories, often need tests based on frequencies or proportions.
Null hypothesis and alternative hypothesis
The null hypothesis gives the reference claim used by the test. It may state that two population means are equal, that two variables are independent, or that a coefficient is zero. The alternative hypothesis describes the kind of departure from the null that the researcher is looking for.
These hypotheses should be written before the final calculation. If the direction of the claim is chosen only after looking at the data, the test becomes easier to bend toward the sample result. A clear hypothesis keeps the analysis tied to the research question.
Test statistic and reference distribution
A test statistic is a number calculated from the sample. It summarises how far the observed result is from what the null hypothesis would predict, while taking sample variation into account. Different statistical tests produce different statistics, such as t, F, z, χ2, or a regression coefficient divided by its standard error.
The reference distribution shows how that statistic would behave if the null hypothesis and the assumptions of the test were treated as true. A result that falls far into the tail of the reference distribution is less compatible with the null hypothesis. This is the basis for the p-value.
Plain reading: the test statistic puts the sample result on a scale where it can be compared with what the null hypothesis would usually produce.
p-value and significance level
The p-value is the probability of obtaining a result at least as extreme as the observed result, assuming the null hypothesis is true and the test assumptions are suitable. A smaller p-value means the sample result would be more unusual under the null hypothesis.
The significance level, usually written as α, is the decision threshold chosen before the test. A common value is α = 0.05. If the p-value is less than or equal to α, the result is often called statistically significant and the null hypothesis is rejected. If the p-value is larger than α, the result is not statistically significant under that rule, and the researcher fails to reject the null hypothesis.
Effect size and confidence interval
The p-value helps with the statistical decision, but it does not show how large the difference or association is. Effect size fills that gap. A mean difference, Cohen’s d, odds ratio, correlation coefficient, or regression coefficient can tell the reader about the size and direction of the result.
A confidence interval adds another layer by showing a range of plausible values for the population effect. A narrow interval suggests a more precise estimate. A wide interval suggests more uncertainty. In many reports, the confidence interval is just as informative as the p-value because it shows what sizes of effect remain compatible with the sample data.
How Statistical Tests Work
Statistical tests work by comparing the pattern found in the sample with the pattern expected if the null hypothesis were true. This comparison may sound abstract, but the logic is close to everyday reasoning about chance variation. If two groups differ slightly, that difference may be ordinary sample noise. If they differ by a large amount relative to their within-group variation, the result becomes harder to explain by chance alone.
The procedure is most transparent when each step is kept visible. In a published article, the calculation may take one line of output from statistical software. In the reasoning behind that output, however, several decisions have already been made.
Step 1: Describe the research situation
The first step is to state what is being compared or tested. This includes naming the outcome variable, the explanatory variable if there is one, the population of interest, and the unit of observation. A study of students, classrooms, schools, or repeated measurements may look similar at first, but these are different data structures.
In a simple education example, the researcher might ask whether students in two independent classes differ in mean exam score. The outcome is numerical. The grouping variable has two categories. Each student contributes one score. That description already points toward a limited set of possible tests.
Step 2: State the hypotheses
The null hypothesis and alternative hypothesis translate the research question into statistical form. For two independent group means, the null hypothesis may state that the population means are equal. The alternative may state that the population means are different.
The hypotheses do not need to use complicated notation for every reader, but they should be clear. A phrase such as “there is no difference” is incomplete unless the reader knows which groups, which outcome, and which population value are being discussed.
Step 3: Choose the significance level
The significance level sets the rule for rejecting the null hypothesis. The value 0.05 is common in introductory statistics and in many research fields, but it is not a law of nature. A stricter threshold may be used when false positive results would lead to a misleading interpretation, while exploratory work may sometimes be reported with more caution instead of a single hard threshold.
The main point is that the rule should be chosen before the result is known. Changing the threshold after seeing the p-value weakens the logic of the test.
Step 4: Select a statistical test
The test should match the question, variables, design, and assumptions. A two-group mean comparison may call for an independent-samples t-test if the groups are unrelated and the outcome is numerical. If the same people are measured before and after an intervention, a paired-samples t-test is more suitable because the measurements are linked.
For categorical counts, a chi-square test may fit better than a test for means. For three or more group means, ANOVA is usually the starting point. For a relationship between two numerical variables, correlation tests or regression may be used, depending on whether the aim is association, modelling, or prediction.
Step 5: Calculate the test statistic and p-value
Most researchers use software for the calculation. Software can reduce arithmetic errors, but it cannot decide whether the analysis makes sense. The researcher still needs to check that the variables are coded correctly, the grouping variable is in the right form, missing data have been handled deliberately, and the output belongs to the intended test.
The test statistic and p-value should be read together with descriptive statistics. A p-value without group means, proportions, sample sizes, or estimates gives a thin picture. Readers need to know what was observed before they can understand what was tested.
Step 6: Interpret the result in context
The final step returns to the research question. If the p-value is below the chosen significance level, the researcher rejects the null hypothesis and describes the direction and size of the result. If the p-value is above the threshold, the researcher reports that the sample did not provide enough evidence to reject the null hypothesis.
That wording is cautious on purpose. A non-significant result is not proof that the groups are identical or that the association is absent. It may mean that the effect is small, the sample is limited, the data are variable, or the study design was not sensitive enough to detect the pattern.
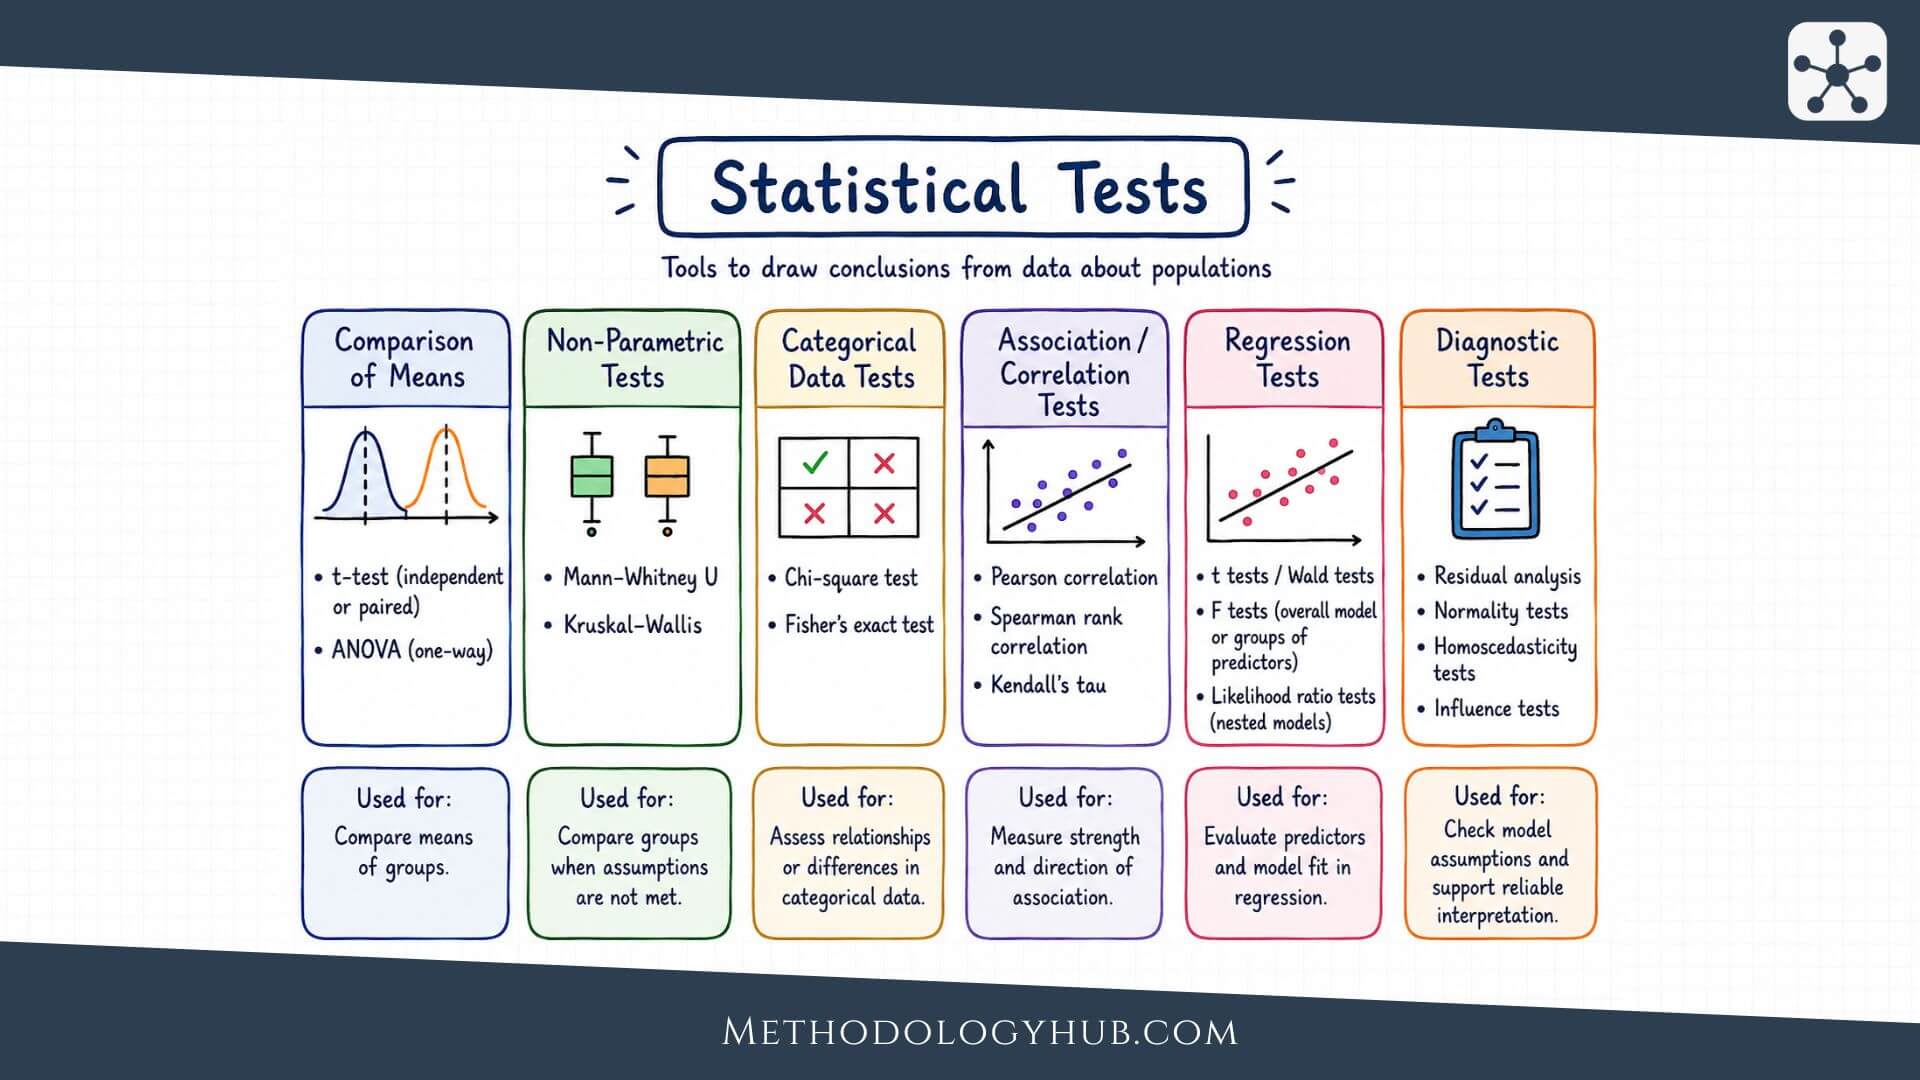
Common Examples of Statistical Tests
Common examples of statistical tests can be grouped by the kind of research question they answer. Some tests compare means. Some tests compare observed counts with expected counts. Others examine relationships between variables or coefficients in a model. The same dataset can sometimes support more than one analysis, but the test should still be chosen for a specific question.
The examples below are introductory rather than exhaustive. They cover tests that students often meet first and that researchers often report in academic writing.
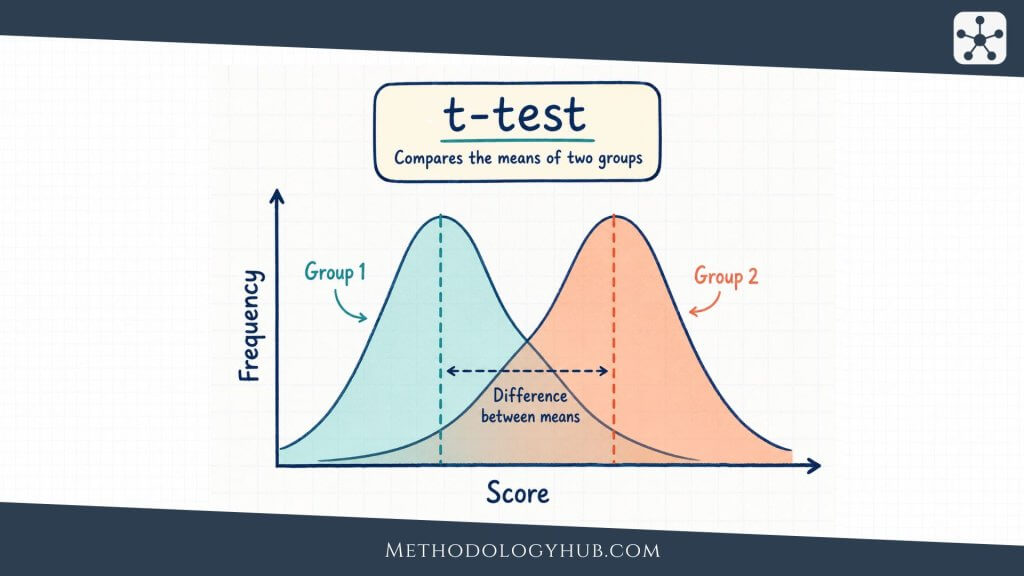
T-tests for means
A t-test is used when the research question focuses on a mean and the outcome is numerical. A one-sample t-test compares one sample mean with a known or hypothesised population value. For example, a researcher may test whether the average score in a sample differs from a benchmark of 70.
An independent-samples t-test compares means from two separate groups. A paired-samples t-test compares two related measurements, such as pre-test and post-test scores from the same students. The word paired is important because the second measurement is linked to the first measurement for the same person or matched case.
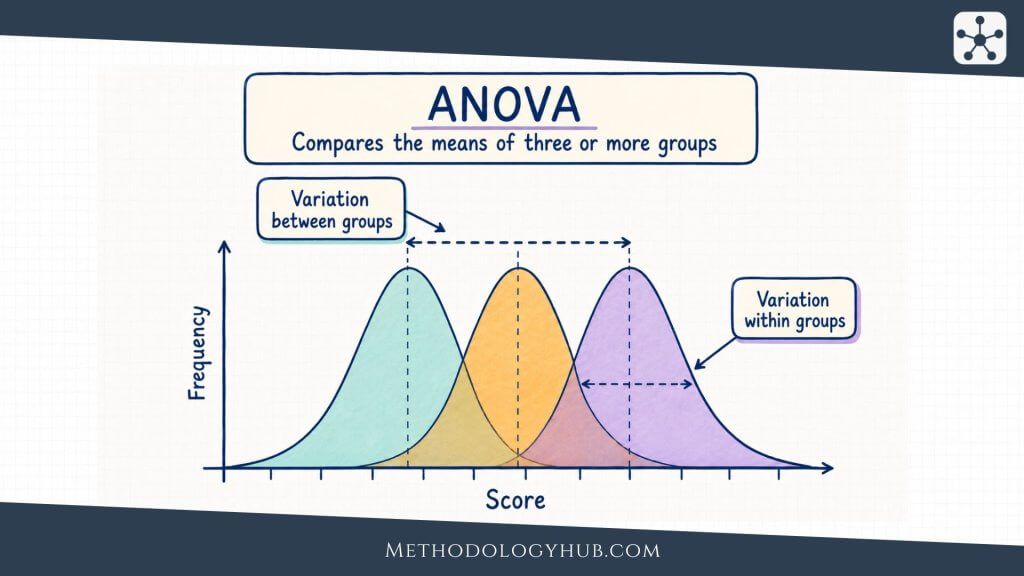
ANOVA for three or more means
ANOVA, or analysis of variance, is used when a researcher wants to compare means across three or more groups. A one-way ANOVA might compare average exam scores across three teaching approaches. Instead of running several separate t-tests, ANOVA evaluates whether the group means differ more than would be expected from variation within the groups.
When ANOVA gives a statistically significant result, follow-up comparisons are often needed to locate which groups differ. These comparisons should be planned or adjusted carefully because repeated testing increases the chance of false positive findings.
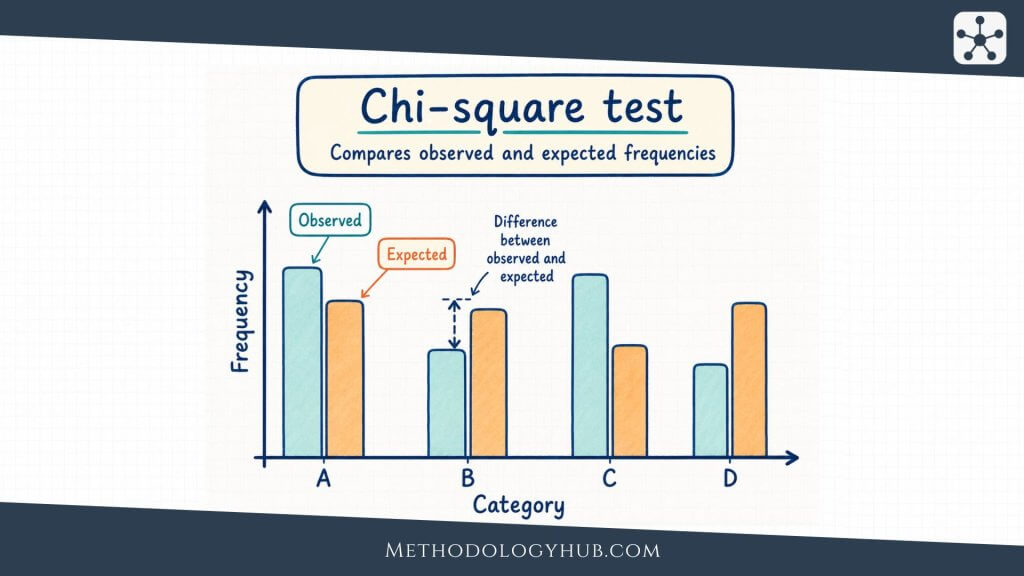
Chi-square tests for categorical data
Chi-square tests are used with categorical variables. A chi-square goodness-of-fit test compares observed counts with expected counts in one categorical variable. For example, a researcher may ask whether students choose four project topics equally often.
A chi-square test of independence examines whether two categorical variables are associated. For example, a researcher may test whether preferred study location is associated with year level. The test compares the observed counts in a table with the counts expected if the two variables were independent.
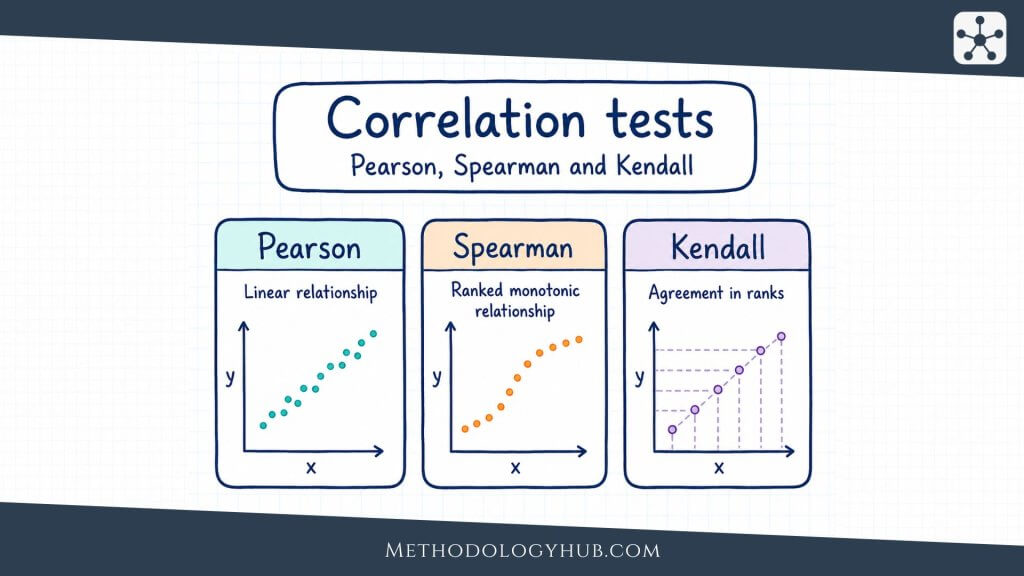
Correlation tests
Correlation tests examine association between two variables. Pearson correlation is used for the linear association between two quantitative variables. Spearman’s rank correlation and Kendall’s tau are often used when ranks, ordinal data, or monotonic relationships are more suitable than a straight-line numerical summary.
If a researcher studies weekly study time and exam score, a correlation test can evaluate whether the observed association is strong enough to support a population-level claim. The result should still be interpreted as association unless the study design supports a causal statement.
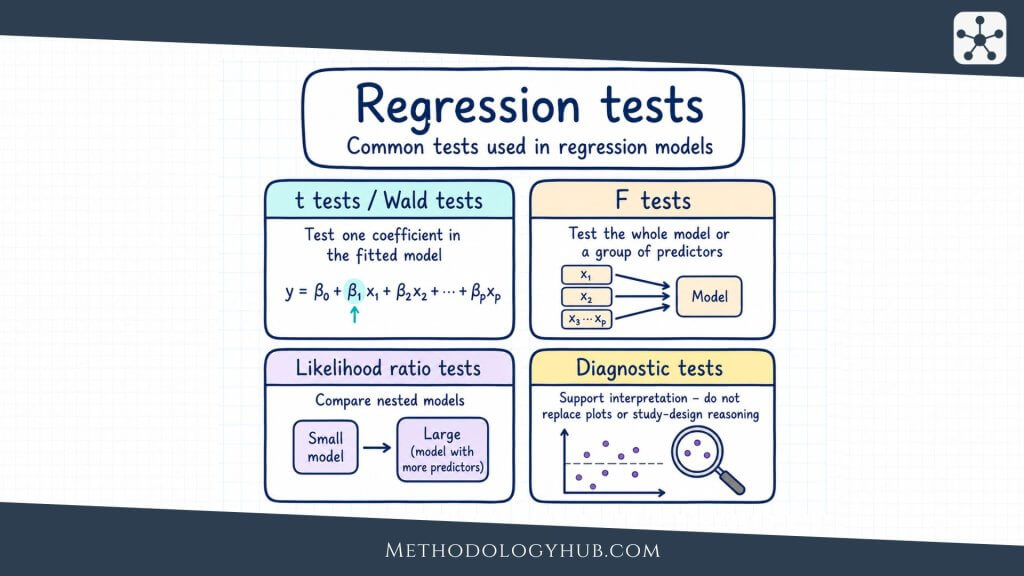
Regression tests
Regression analysis models an outcome variable using one or more predictors. In simple linear regression, the test of the slope asks whether the predictor is statistically associated with the outcome. In multiple regression, each coefficient is often tested while the other predictors in the model are held constant.
Regression tests are useful when the research question goes beyond a pairwise association. A researcher may want to examine whether study time predicts exam score after accounting for prior achievement, or whether a set of predictors is associated with a health outcome. The model should match the measurement level of the outcome and the structure of the data.
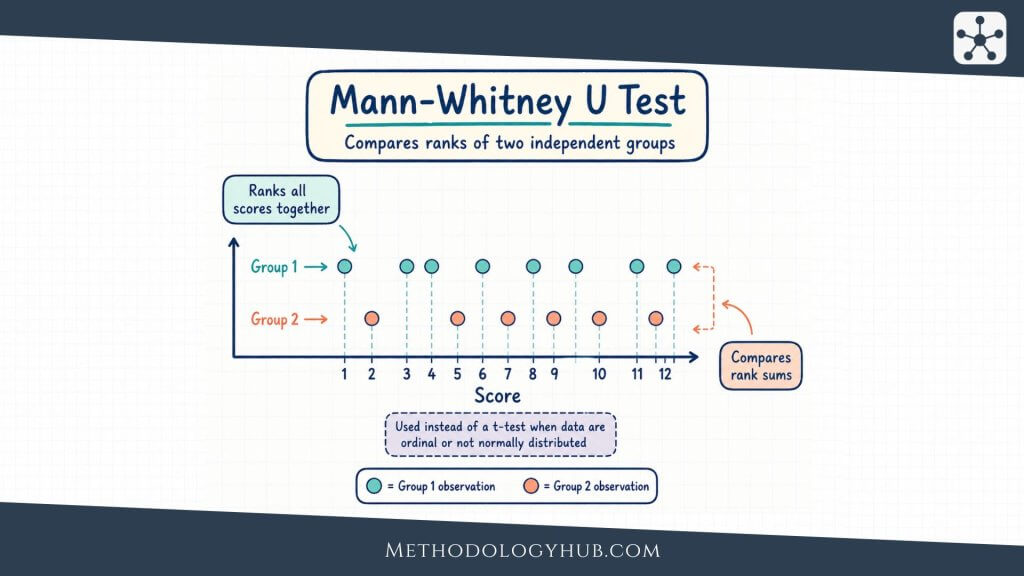
Mann-Whitney U test and other rank-based tests
The Mann-Whitney U Test is a rank-based test often used to compare two independent groups when a usual t-test is not suitable. It may be used with ordinal outcomes or with numerical data that are strongly skewed, especially when the research question can be expressed in terms of ranked values or distributional differences.
Other rank-based tests include the Wilcoxon signed-rank test for paired observations and the Kruskal-Wallis test for three or more independent groups. These tests are not simply backup versions of parametric tests. They answer questions through ranks, so the interpretation should match the method.
Parametric vs. Non-Parametric Test
The distinction between parametric and non-parametric tests is one of the most common ways of grouping statistical tests. It is also one of the easiest distinctions to oversimplify. A parametric test is usually built around assumptions about population parameters and, often, about the distribution of the outcome or model residuals. A non-parametric test makes fewer assumptions about a specific distribution and often works with ranks, signs, medians, or counts.
The choice is not a contest between “strong” and “weak” methods. A parametric test can be very efficient when its assumptions are reasonable. A non-parametric test can be more suitable when the measurement level, distribution, or sample structure does not fit the parametric approach.
Parametric tests
Parametric tests are commonly used with numerical outcomes. Many focus on means, variances, correlations, or regression coefficients. They often assume that observations are independent, that the outcome or residuals are approximately normally distributed in the relevant groups, and that variances are similar when the test compares groups.
Examples include one-sample t-tests, independent-samples t-tests, paired-samples t-tests, one-way ANOVA, Pearson correlation, and linear regression coefficient tests. These methods are widely used because they give clear estimates and often have good statistical power when the data fit the assumptions well.
Non-parametric tests
Non-parametric tests are often used when the outcome is ordinal, strongly skewed, dominated by outliers, or not well represented by means. Many non-parametric tests replace the original values with ranks. This makes them less dependent on the original scale and less sensitive to some kinds of extreme values.
Examples include the Mann-Whitney U test, Wilcoxon signed-rank test, Kruskal-Wallis test, Friedman test, Spearman’s rank correlation, and Kendall’s tau. These tests can be especially useful in student projects and applied research where data are measured on rating scales or where sample sizes are modest.
How the interpretation differs
A parametric test and its non-parametric counterpart may look like direct substitutes, but they often do not test exactly the same claim. An independent-samples t-test focuses on a difference between means. The Mann-Whitney U test is based on ranks and is often interpreted in relation to whether values from one group tend to be higher or lower than values from another group.
This difference affects reporting. If a researcher uses a t-test, reporting means and standard deviations is usually natural. If a researcher uses a rank-based test, medians, interquartile ranges, rank summaries, or distribution descriptions may fit better. The descriptive statistics should match the test, not simply copy a default table.
When sample size changes the decision
Sample size affects how strict the assumptions need to feel in practice. With larger samples, some parametric tests are reasonably stable when distributions are not perfectly normal, especially if the data are not extremely skewed and there are no severe outliers. With very small samples, it can be harder to assess distributional assumptions, and the choice requires more care.
A large sample does not solve every problem. If the observations are not independent, if the sample is biased, or if the variable is measured on the wrong scale for the test, the calculation may still produce a misleading answer. Assumptions about design and measurement are just as relevant as assumptions about distribution shape.
| Aspect | Parametric test | Non-parametric test |
|---|---|---|
| Typical data | Numerical measurements | Ordinal, ranked, skewed, or non-normal data |
| Common focus | Means, variances, coefficients | Ranks, signs, medians, distributions |
| Examples | t-test, ANOVA, Pearson correlation | Mann-Whitney U, Wilcoxon, Kruskal-Wallis, Spearman |
| Reporting fit | Means, standard deviations, confidence intervals | Medians, interquartile ranges, ranks, distribution summaries |
Selection Criteria and Assumptions
Selecting statistical tests is a process of matching the question to the data. The researcher does not need to memorise every possible test before beginning. It is usually enough to move through a few selection criteria in order: the research question, outcome type, number of groups or measurements, independence or pairing, distribution shape, sample size, and planned interpretation.
This process also helps prevent a common problem in student work: choosing a test because it is familiar, then trying to force the research question into that test. A good selection process works in the opposite direction.
Start with the outcome variable
The outcome variable is the variable being compared, predicted, or explained. If the outcome is numerical, tests for means, correlations, or regression may be relevant. If the outcome is categorical, tests for proportions, counts, or categorical models are usually more appropriate.
The outcome should be treated according to how it was measured. A five-point rating item may not behave like a continuous numerical variable, especially if responses are clustered at one end. A scale made from many items may behave more like a numerical score. The decision should be explained when it is not obvious.
Check the number of groups or measurements
The number of groups helps separate similar tests. One numerical sample compared with a benchmark suggests a one-sample t-test or a non-parametric alternative. Two independent groups suggest an independent-samples t-test or Mann-Whitney U test. Three or more independent groups suggest ANOVA or Kruskal-Wallis.
Related measurements require different tests. If the same students are measured before and after a course, the observations are paired. If patients are matched by age or school classes are paired by size, the analysis should respect that pairing. Treating paired observations as independent can waste information and distort the standard error.
Examine independence
Independence means that one observation does not determine or strongly depend on another observation in the analysis. Many basic statistical tests assume independence. This assumption can be strained when data are clustered within classrooms, families, clinics, schools, laboratories, or repeated measurements from the same participant.
When observations are nested or repeated, a simple test may make the sample look more informative than it really is. In those situations, the researcher may need a paired test, repeated-measures method, mixed model, cluster-aware analysis, or a more limited interpretation.
Selection shortcut: first ask what kind of outcome you have, then ask how many groups or measurements are being compared, then ask whether the observations are independent or linked.
Look at distribution shape and outliers
Distribution shape affects tests that rely on means and standard errors. A roughly symmetric numerical outcome with no severe outliers may fit a parametric test well. A strongly skewed outcome or a dataset dominated by a few extreme values may need transformation, a rank-based test, a model designed for that outcome, or a careful descriptive approach.
Graphs are useful here. Histograms, boxplots, and scatterplots often show problems more clearly than a formal normality test alone. A normality test can become significant in very large samples even when the departure is small, and it can fail to detect problems in small samples. The researcher should look at the pattern, rather than relying on a single assumption test.
Consider equal variances
Some group comparison tests assume similar variances across groups. In an independent-samples t-test, unequal variances can affect the standard error and the degrees of freedom. Welch’s t-test is often used when variances are not equal. In ANOVA, unequal variances and unequal group sizes can be especially awkward.
The question is not whether the variances are perfectly identical. Real data rarely behave that neatly. The question is whether the difference in spread is large enough to make the usual test a poor fit. If group spreads are very different, the result should be analysed with a method that accounts for that difference or interpreted cautiously.
Match the test to the planned claim
Test selection should also reflect the claim the researcher wants to make. A chi-square test of independence can show association between categorical variables, but it does not describe direction in the same way a regression coefficient does. A correlation test can describe association between two variables, but it does not adjust for other predictors unless a different method is used.
When a study asks a more complex question, the test may need to be more complex too. A simple two-group test may be suitable for a classroom exercise, while a research article with repeated observations, covariates, and clustered sampling may require a model-based analysis.
| Selection question | What to check | Effect on test choice |
|---|---|---|
| What is the outcome? | Numerical, ordinal, categorical, count | Separates mean tests, rank tests, categorical tests, and models |
| How many groups? | One, two, three or more | Helps distinguish one-sample tests, t-tests, and ANOVA |
| Are observations linked? | Independent, paired, repeated, clustered | Determines whether independent, paired, or model-based methods are needed |
| What is the shape? | Skew, outliers, linearity, spread | May support parametric, non-parametric, transformed, or model-based analysis |
| What claim will be reported? | Difference, association, prediction, adjusted estimate | Connects the test result to the wording of the conclusion |
Interpretation of Statistical Tests
Interpretation of statistical tests should move from the statistical output back to the research question. The output may include a test statistic, degrees of freedom, p-value, confidence interval, effect size, group means, proportions, or model coefficients. These pieces should not be read as separate fragments. Together, they tell the reader what was observed, how uncertain it is, and how strongly the data challenge the null hypothesis.
A good interpretation is usually modest. It says what the data support under the method used, and it avoids stronger language than the study design can carry. This is especially relevant when the design is observational, the sample is small, or the assumptions are only partly satisfied.
Reading a statistically significant result
A statistically significant result means that the p-value is at or below the chosen significance level. Under the rules of the test, the sample result is considered unusual enough under the null hypothesis to reject that null hypothesis. The next sentence should tell the reader the direction and size of the result.
For example, it is thin to write only that two groups differed significantly. It is clearer to state which group had the higher mean, how large the difference was, and how precise the estimate appears. A sentence that includes the mean difference and confidence interval usually gives the reader a better sense of the result than the p-value alone.
Reading a non-significant result
A non-significant result means that the sample did not provide enough evidence to reject the null hypothesis under the chosen test. It does not prove that the null hypothesis is true. The study may have had too few observations, too much variability, a weak measurement instrument, or an effect too small to detect with the available data.
Confidence intervals are especially useful here. If a confidence interval is wide, the study may be compatible with several possible effect sizes, including values that could still be meaningful in the research setting. If the interval is narrow and close to zero, the result gives a different kind of information. The p-value alone cannot show that distinction.
Effect size before labels
Labels such as small, moderate, and large can help readers, but they should not replace the actual estimate. A difference of 3 points may be small in one test score and large in another. A correlation of .30 may be treated differently in psychology, education, biology, or measurement research.
The interpretation should therefore name the variables and describe the result in the study context. If exam scores were 6 points higher in one group, the reader should know the scale of the exam, the sample size, and the confidence interval. If a correlation was positive, the reader should know whether the pattern is linear, whether outliers influenced it, and whether the design allows only association language.
Degrees of freedom and sample size
Degrees of freedom are part of many test reports. They are connected to how much independent information is available for estimating variation. In a one-sample t-test, the degrees of freedom are usually n – 1. In a Pearson correlation test, they are usually n – 2. In ANOVA and chi-square tests, they depend on the number of groups, categories, or model terms.
For many readers, sample size is more immediately understandable than degrees of freedom. Reporting both can be helpful. A result from 24 observations should not be read the same way as a similar result from 2,400 observations, even if both cross a significance threshold.
Writing results in academic style
A clear report names the test, gives the relevant statistic, includes the p-value, and connects the result to the research question. Where possible, it also includes an effect size and confidence interval. The sentence should be informative without turning into a dump of software output.
Example: Students in the revision group had higher mean scores than students in the comparison group, t(58) = 2.41, p = .019, mean difference = 5.8 points, 95% CI [1.0, 10.6].
The example gives more than a yes-or-no decision. It tells the reader which group scored higher, gives the test statistic, reports the p-value, and shows the estimated size and uncertainty of the difference. A short interpretation can then follow in ordinary language.
Connecting statistical and substantive interpretation
Statistical interpretation and substantive interpretation are related but not identical. A result can be statistically significant and still be too small to carry much weight in the study context. A result can also be non-significant but uncertain enough that further research would be reasonable.
The strongest interpretation keeps the statistical result, study design, measurement quality, and practical scale together. In experimental studies, the design may support stronger causal language if allocation, control, and measurement are suitable. In correlational or observational studies, association language is usually safer, even when the statistical test is highly significant.
Conclusion
Statistical tests give researchers a structured way to examine patterns in sample data. They are used to compare means, examine categorical counts, test relationships between variables, and evaluate coefficients in statistical models. The useful part of a test is larger than the calculation itself. It is the discipline of connecting a research question, a data structure, a hypothesis, and an interpretation.
The choice of test should begin with the question being asked. A comparison of two means, a table of counts, a ranked outcome, and a regression coefficient are different situations. Each calls for a method that fits the variables, the sample structure, and the assumptions that can reasonably be defended.
Interpretation should stay close to the evidence. A p-value can support a decision about the null hypothesis, but it does not show the size of the effect or prove a research claim. Effect sizes, confidence intervals, descriptive statistics, and study design help turn the test result into a clearer statement. When these pieces are read together, statistical tests become a careful way of reasoning from sample data rather than a mechanical final step.
FAQs on Statistical Tests
What are statistical tests?
Statistical tests are procedures used to evaluate sample data against a statistical assumption or model. They help researchers test claims about differences, relationships, counts, proportions, or coefficients while accounting for sample variation.
What are examples of statistical tests?
Examples of statistical tests include t-tests, ANOVA, chi-square tests, Pearson correlation tests, Spearman correlation tests, regression coefficient tests, Mann-Whitney U tests, Wilcoxon signed-rank tests, and Kruskal-Wallis tests.
How do you choose the right statistical test?
To choose the right statistical test, identify the research question, outcome variable type, number of groups or measurements, whether observations are independent or paired, and whether the assumptions of the test are reasonable.
What is the difference between parametric and non-parametric statistical tests?
Parametric statistical tests usually focus on numerical parameters such as means or coefficients and rely on assumptions about the data or residuals. Non-parametric tests make fewer distributional assumptions and often use ranks, ordered values, signs, or medians.
What does a p-value tell you in statistical tests?
A p-value tells you how unusual the observed result would be if the null hypothesis were true and the test assumptions were suitable. It does not give the probability that the null hypothesis is true, and it does not measure the size of an effect.


