
Correlation tests are statistical tests used to examine whether two variables are associated in a population, based on the pattern observed in sample data. They are often used after a researcher has collected paired observations and wants to know whether the relationship seen in a scatterplot, table, or set of ranks is strong enough to support an inferential conclusion.
This article explains what correlation tests are, how Pearson, Spearman, and Kendall correlation tests differ, which assumptions need attention, when to use each test, how the calculation is usually carried out, how to interpret the result, and how to report correlation tests in academic writing.
What Are Correlation Tests?
Correlation tests are used when a researcher wants to test whether two variables are associated in a population. The starting point is usually a sample correlation: one number calculated from paired observations. The test then asks whether a sample relationship of that size could reasonably appear if the population correlation were zero.
For example, a researcher may collect data from students on weekly study time and exam score. A scatterplot may show that students with more study time tend to have higher scores. A correlation coefficient can summarise that pattern, and a correlation test can evaluate whether the observed association is strong enough to reject the null hypothesis of no population correlation.
Correlation tests definition
A correlation test is an inferential statistical procedure that evaluates whether the association between two variables in a sample provides evidence of an association in the population. The result usually includes a correlation coefficient, a test statistic or test basis, a p-value, and often a confidence interval.
The coefficient and the test answer related but different questions. The coefficient describes the direction and strength of the association in the sample. The test addresses uncertainty. It asks whether the sample evidence is strong enough to support a population-level claim under the assumptions of the selected method.
How correlation tests fit into statistical testing
Correlation tests are part of inferential statistics because they move from a sample result to a claim about a wider population or process. If a researcher says that the correlation in one class of 30 students is 0.42, that is a sample description. If the researcher tests whether the population correlation differs from zero, the analysis becomes inferential.
This makes correlation tests different from simply looking at a correlation coefficient. A coefficient can be large in a small sample and still be uncertain. A smaller coefficient in a large, well-measured sample may provide clearer evidence. The test brings sample size, variability, and the chosen null hypothesis into the interpretation.
Correlation is about association
Correlation tests examine association. They do not, by themselves, show that one variable causes the other. A positive correlation between reading time and vocabulary score may be consistent with several explanations. Reading may support vocabulary development. Students with stronger vocabulary may read more. A third variable, such as home literacy resources, may affect both.
That is why correlation tests should be read with the study design. Cross-sectional observational data can show whether variables move together. Causal interpretation needs more than a correlation test, such as a suitable design, time order, control of alternative explanations, and a research question that supports that kind of claim.
Key Aspects of Correlation Tests
Correlation tests become easier to understand when the main pieces are seen together. A researcher begins with paired observations, chooses a correlation coefficient that fits the data, states a null hypothesis, calculates the sample association, and then interprets the result with attention to sample size and assumptions.
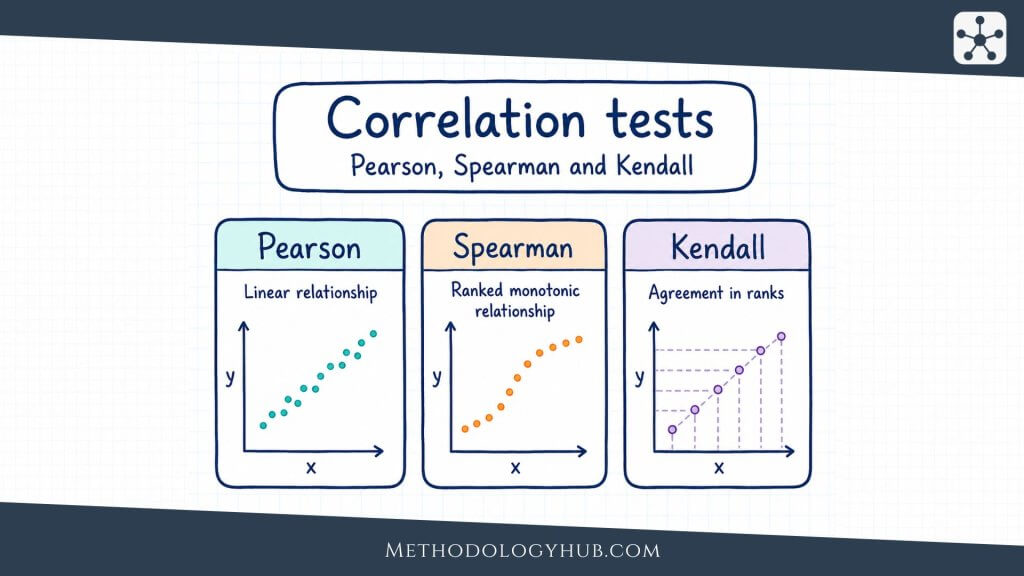
The same broad logic appears in Pearson, Spearman, and Kendall tests, but the details differ. Pearson works with the original numerical values and focuses on linear association. Spearman changes the values into ranks and focuses on monotonic association. Kendall also works with ranks, but it reads the data through concordant and discordant pairs.
Paired observations
A correlation test needs paired observations. Each case must have a value on both variables. In a student dataset, each student may have one value for study time and one value for exam score. In a health dataset, each participant may have one value for physical activity and one value for blood pressure.
The pairing is important because the relationship is examined within cases. If the study time values come from one group of students and the exam scores come from a different unrelated group, the two variables cannot be correlated in the usual way. The test needs matched x and y values for the same units of observation.
Direction and strength
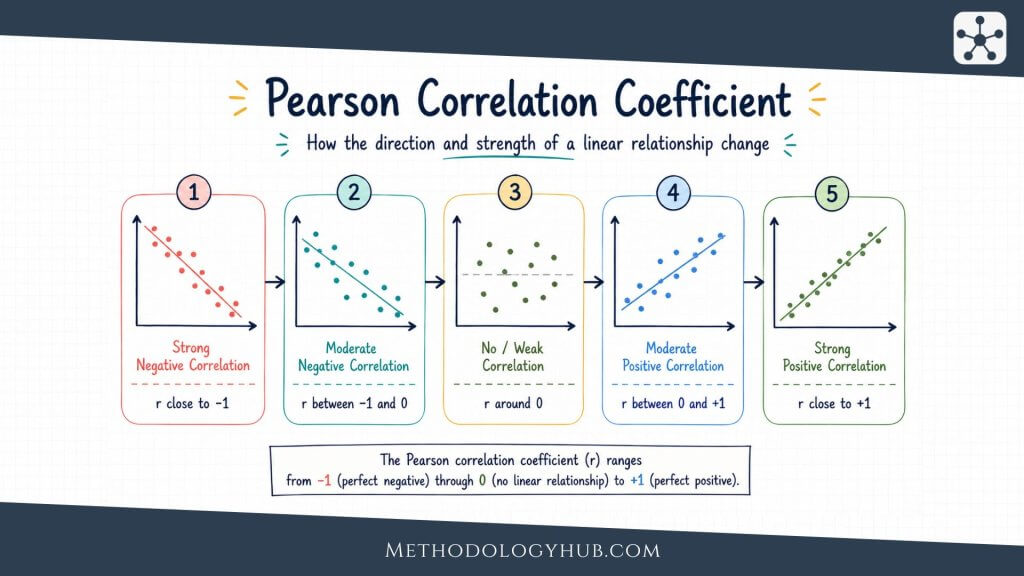
Correlation coefficients usually range from -1 to +1. A positive value means higher values on one variable tend to go with higher values on the other. A negative value means higher values on one variable tend to go with lower values on the other. A value near zero means the test has found little evidence of the specific kind of association measured by that coefficient.
Strength is read by looking at the distance from zero. A correlation of -0.70 is stronger than a correlation of +0.25, even though the first is negative. The sign tells the direction. The absolute size tells how closely the data follow the kind of pattern the coefficient is designed to summarise.
Null and alternative hypotheses
Most correlation tests begin with a null hypothesis stating that the population correlation is zero. For Pearson’s correlation, this is often written as H0: ρ = 0. The alternative hypothesis may state that the population correlation is not zero, greater than zero, or less than zero.
A two-sided alternative is used when either direction would be meaningful. A one-sided alternative is used only when the direction is specified before analysis and the opposite direction would not support the research claim. This decision should not be made after seeing the sample correlation.
p-value and confidence interval
The p-value helps the researcher judge how unusual the sample result would be if the null hypothesis were true. If the p-value is below the chosen significance level, the researcher rejects the null hypothesis. If it is above the significance level, the researcher fails to reject it.
A confidence interval adds more information because it gives a range of plausible values for the population correlation. This is often more useful than the p-value alone. A correlation of 0.34 with a wide confidence interval may be less precise than a correlation of 0.28 with a narrow interval, especially when the research question needs an estimate of the size of the association.
Plain reading: a p-value helps with the decision about the null hypothesis. A confidence interval helps the reader see how precise the estimated correlation is.
Sample size
Sample size affects correlation tests strongly. With a small sample, even a fairly visible association may not be statistically significant. With a very large sample, a small association may become statistically significant even if it has little practical meaning in the study context.
This is why a correlation test should not be reduced to “significant” or “not significant.” The sample size, coefficient, confidence interval, measurement quality, and research design all shape the interpretation. Statistical significance tells one part of the story, not the whole result.
Types of Correlation Tests
The three correlation tests most often introduced together are Pearson, Spearman, and Kendall. They all examine association between two variables, but they do not read the data in the same way. Choosing among them depends on the measurement level, the shape of the relationship, the presence of outliers, and the kind of association the researcher wants to describe.
A useful starting point is to look at the scatterplot or the paired ranks before choosing the test. The test should match the question and the data pattern. It should not be chosen only because it gives the smallest p-value.
Pearson correlation test
The Pearson correlation test is used for two quantitative variables when the research question concerns a linear association. It works with the original measured values. If the scatterplot forms a roughly straight upward or downward pattern, Pearson’s r can give a clear summary of direction and strength.
Pearson’s correlation is common in education, psychology, medicine, biology, and social science when variables are measured as scores, times, ages, distances, scale totals, or other numerical values. It is also closely related to simple linear regression. When there is one predictor and one outcome, the Pearson correlation and the slope test in simple regression are connected, although regression answers a different modelling question.
Spearman rank correlation test
The Spearman correlation test is used when the association is monotonic rather than necessarily linear, or when the variables are ordinal. A monotonic relationship means that as one variable increases, the other tends to move in one direction, but the pattern does not have to form a straight line.
Spearman’s correlation changes the original values into ranks before calculating the association. This makes it useful when the exact distances between values are less meaningful than their order. For example, a researcher may examine the association between students’ rank in class participation and rank in final project score.
![]()
Kendall rank correlation test
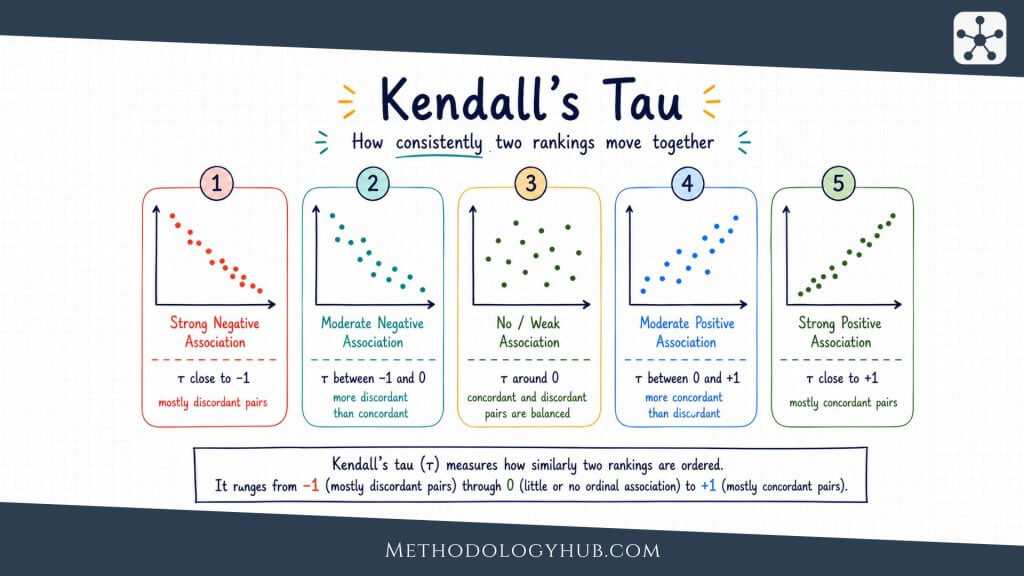
Kendall’s tau is another rank-based correlation test. It compares pairs of observations and asks whether their order agrees across the two variables. If two students are ordered the same way on both variables, the pair is concordant. If their order is reversed, the pair is discordant.
Kendall’s tau is often useful with smaller samples, ordinal variables, and data with many tied ranks. Its value is usually smaller in absolute size than Spearman’s rho for the same dataset, so the two coefficients should not be compared as if they used exactly the same scale of interpretation.
Comparison of Pearson, Spearman, and Kendall
| Test | Best fit | What it reads |
|---|---|---|
| Pearson correlation test | Two quantitative variables with a roughly linear pattern | Association in the original measured values |
| Spearman correlation test | Ordinal variables or monotonic relationships | Association between ranks |
| Kendall correlation test | Ordinal data, smaller samples, or many ties | Agreement and disagreement between ordered pairs |
The table gives a starting point, not a rule that can be applied without looking at the data. A scatterplot may show a curve. A ranked table may reveal many ties. A small dataset may contain one observation that changes the result. These details often decide which test gives the fairest summary.
Assumptions
Assumptions help the researcher decide whether a correlation test is suitable for the data. They are not meant to make analysis difficult. They keep the result connected to the kind of pattern the test can actually describe.
Some assumptions apply to most correlation tests, such as paired observations and independence. Other assumptions are more specific. Pearson’s test needs a stronger focus on quantitative measurement, linearity, and influential points. Rank-based tests are more flexible in some situations, but they still require careful interpretation.
Paired and independent observations
Each observation should contain a pair of values measured on the same case. At the same time, the pairs should usually be independent of one another. If several measurements come from the same person, classroom, school, family, laboratory batch, or repeated session, ordinary correlation tests may treat related data as if they were independent.
When observations are clustered or repeated, the researcher may need a design-specific method. A repeated-measures correlation, multilevel model, or another approach may fit better than a standard correlation test. The correct choice depends on the sampling and measurement structure.
Measurement level
Pearson’s test is intended for quantitative variables where numerical differences are meaningful. Spearman and Kendall can be used with ordinal variables because they work with order rather than exact distances. A five-point rating item, for example, may fit a rank-based test better than Pearson’s test, especially if the scale has few categories.
Scale totals require judgement. A total score made from many questionnaire items may behave like a quantitative variable, while a single ordered item may not. The article or report should make this choice clear enough for the reader to follow.
Shape of the relationship
For Pearson’s correlation, the relationship should be roughly linear. This is best checked with a scatterplot. If the points form a curve, Pearson’s r may be close to zero even when the variables are clearly related. In that case, a different analysis may be needed.
Spearman and Kendall are often better when the relationship is monotonic. The pattern may rise quickly at first and then level off, or fall in a steady but curved way. For these tests, the main question is whether the order of values tends to move consistently in one direction.
Before testing: draw the scatterplot when the variables are numerical. A correlation test is easier to interpret when the shape of the data is visible.
Outliers and tied ranks
Outliers can strongly affect Pearson’s correlation. A single extreme point may pull the coefficient upward, downward, or closer to zero. This does not mean unusual values should be deleted. It means they should be checked and explained.
Rank-based tests are often less sensitive to extreme measured values because they use order. They are not free from data problems, however. Many tied ranks can affect the calculation and interpretation of Spearman and Kendall tests. Statistical software usually handles ties, but the researcher still needs to notice them.
Normality and inference
Pearson’s usual significance test works best when the joint distribution of the two variables is reasonably close to bivariate normal, or when the sample is large enough for the test to be stable. In practice, the scatterplot, sample size, outliers, and design are often more informative than a normality test alone.
Spearman and Kendall do not require the same normality assumption because they use ranks. They are often described as nonparametric correlation tests. That does not mean they can be used without thought. The observations still need to be paired, the association should match the kind of pattern being tested, and the interpretation should match the measurement level.
When to Use Correlation Tests
Use correlation tests when the research question asks whether two variables are associated and both variables are measured for the same cases. The question should be about co-variation rather than group comparison. If the main question asks whether two group means differ, a t-test may be more suitable. If it asks whether three or more means differ, ANOVA may fit better.
Correlation tests are especially useful early in analysis, when the researcher wants to examine relationships among measured variables. They can also be used as part of a planned hypothesis test, where the researcher has a clear expectation about the direction or presence of an association.
Use correlation tests for two-variable association
A correlation test fits questions such as whether reading time is associated with comprehension score, whether reaction time is associated with age, or whether two rating scales move together. In each case, the researcher has two variables measured for the same people, records, objects, or occasions.
The wording of the research question should stay close to association. A good correlation question asks whether variables tend to vary together. It does not ask whether one variable caused the other unless the design can support that claim through additional evidence.
Use Pearson, Spearman, or Kendall according to the data
Pearson’s test is usually appropriate when both variables are quantitative and the scatterplot supports a straight-line reading. Spearman’s test is often appropriate when the variables are ordinal, ranked, or related in a monotonic but not clearly linear way. Kendall’s test is useful when the analysis is based on rank agreement, especially in smaller samples or when ties are common.
A researcher may also compare more than one coefficient when there is a reason to do so. For example, Pearson and Spearman results may be compared as a sensitivity check when outliers are present. If the results differ sharply, the scatterplot should be examined again before the interpretation is written.
Use another test when the question is not about correlation
Correlation tests are not the best answer for every relationship question. If both variables are categorical, a chi-square test may fit the data better. If the researcher wants to predict an outcome from one or more predictors, regression tests or regression analysis may be needed.
If the task is to compare two independent groups on an ordinal or non-normal outcome, the Mann-Whitney U test may be more suitable. The test should follow the structure of the question, not only the names of the variables.
| Research situation | Possible method | Reason |
|---|---|---|
| Two quantitative variables, straight-line pattern | Pearson correlation test | Tests linear association |
| Ordinal variables or monotonic pattern | Spearman correlation test | Tests association between ranks |
| Rank agreement, smaller sample, or many ties | Kendall correlation test | Compares concordant and discordant pairs |
| Two categorical variables | Chi-square test | Tests association in category counts |
Example Usage
A worked example shows how correlation tests move from a research question to an interpretation. Suppose a teacher wants to examine whether weekly study hours are associated with exam scores. The teacher collects data from eight students. The example is small on purpose, so the steps can be followed easily. A real study would usually need a stronger sampling plan and a larger sample.
| Student | Study hours | Exam score |
|---|---|---|
| A | 2 | 61 |
| B | 3 | 65 |
| C | 4 | 70 |
| D | 5 | 72 |
| E | 6 | 78 |
| F | 7 | 80 |
| G | 8 | 84 |
| H | 9 | 87 |
Step 1: State the research question
The research question is: Are study hours associated with exam scores among students in this sample’s wider course population? The two variables are study hours and exam score. Both are quantitative, and both are measured for each student.
Because the question is about association between two paired numerical variables, a correlation test is a reasonable starting point. The next step is to check whether Pearson’s test fits the pattern or whether a rank-based test would be better.
Step 2: Examine the pattern
The values suggest an upward pattern. Students with fewer study hours tend to have lower scores, while students with more study hours tend to have higher scores. If these points were drawn in a scatterplot, one straight line would be a reasonable summary.
That visual check supports the use of Pearson’s correlation test. If the pattern were curved, or if the variables were ordinal ranks, Spearman or Kendall might be more suitable.
Step 3: State the hypotheses
For a two-sided Pearson correlation test, the hypotheses can be written as follows:
Null hypothesis: H0: ρ = 0. There is no linear correlation between study hours and exam scores in the population.
Alternative hypothesis: Ha: ρ ≠ 0. There is a linear correlation between study hours and exam scores in the population.
The two-sided form is used because the test allows either a positive or negative population correlation. In this example, the sample pattern looks positive, but the hypothesis structure should be set before the final calculation is interpreted.
Step 4: Calculate and test the coefficient
Using the paired values above, Pearson’s correlation is approximately r = 0.99. With n = 8, the usual test of H0: ρ = 0 would produce a very small p-value. In plain terms, a sample correlation this strong would be unusual if the population correlation were zero and the assumptions of the test were reasonable.
The exact number is less important here than the logic. The coefficient describes a strong positive linear pattern in the sample. The test asks whether that sample pattern provides enough evidence to reject the null hypothesis for the population.
Step 5: Write the interpretation
A careful interpretation might say: “Study hours and exam scores were strongly positively correlated in the sample. A Pearson correlation test provided evidence against the null hypothesis of zero population correlation.” This keeps the interpretation tied to association.
It would be less careful to write that study hours caused higher exam scores. The data may support that idea, but the correlation test alone does not prove it. A better report stays close to what the test actually evaluates and leaves causal language for designs that can support it.
Interpretation of Correlation Tests
Interpreting correlation tests means reading several pieces together. The coefficient gives direction and strength. The p-value gives evidence against the null hypothesis. The confidence interval gives precision. The design tells the reader how far the conclusion can go.
A smooth interpretation moves between these pieces rather than treating them as separate labels. The result should tell the reader what was tested, what was found, how certain the estimate is, and what kind of claim the study can support.
Interpreting direction
The direction is shown by the sign of the coefficient. A positive correlation means higher values on one variable tend to appear with higher values on the other. A negative correlation means higher values on one variable tend to appear with lower values on the other.
Direction should always name the variables. A statement such as “the correlation was positive” is incomplete on its own. A clearer sentence says, for example, “Higher study time was associated with higher exam scores.”
Interpreting strength
The strength of a correlation is usually read from the absolute value of the coefficient. Values closer to 1 or -1 show a stronger association. Values closer to zero show a weaker association. Labels such as small, moderate, and strong can be useful, but they should not replace context.
A correlation of 0.25 may be meaningful in one field and modest in another. Measurement error, sample size, outcome type, and the research setting all affect interpretation. It is better to explain what the coefficient means for the variables being studied than to rely only on a general label.
Interpreting statistical significance
A statistically significant correlation means the test provided enough evidence to reject the null hypothesis at the chosen significance level. It does not mean the association is large, important, causal, or free from bias. It means the observed association would be unlikely under the null hypothesis, given the test conditions.
A non-significant result should also be read carefully. It does not prove that no association exists. It may mean that the sample was small, the estimate was imprecise, the association was weak, or the data did not fit the method well. A confidence interval helps show which values remain plausible.
Interpreting Pearson, Spearman, and Kendall results
Pearson’s r should be interpreted as a linear association in the original values. Spearman’s rho should be interpreted as an association between ranks, often reflecting a monotonic pattern. Kendall’s tau should be interpreted as the balance of concordant and discordant pairs.
These differences affect the wording. A Pearson result might say that two scores are linearly associated. A Spearman result might say that higher ranks on one variable tend to go with higher ranks on another. A Kendall result might say that the ordering of cases tends to agree across the two variables.
| Result | Plain interpretation |
|---|---|
| r = 0.62, p < 0.05 | A positive linear association was observed, and the test rejected the null hypothesis at the chosen level. |
| r = -0.18, p = 0.31 | A weak negative sample association was observed, but the test did not provide enough evidence to reject zero correlation. |
| Spearman’s ρ = 0.48, p < 0.05 | Higher ranks on one variable tended to go with higher ranks on the other. |
Reporting Correlation Tests
A report of a correlation test should give enough information for the reader to understand the result without guessing. At minimum, it should name the test, name the variables, give the coefficient, give the sample size, and give the p-value. When the result is central to the study, a confidence interval is also helpful.
The interpretation should be written in ordinary research language. It should not only list numbers. A reader should be able to see which variables were associated, in which direction, and how the result fits the research question.
What to include in the report
For Pearson’s correlation, a compact report may include r, degrees of freedom, sample size, and p-value. For Spearman, report Spearman’s rho or rs, sample size, and p-value. For Kendall, report Kendall’s tau, sample size, and p-value.
If the software gives a confidence interval, include it when the coefficient is important for the argument. The interval helps prevent an overconfident reading of a single number.
Example report: Study hours and exam scores were positively correlated, r(6) = .99, p < .001, suggesting that students who reported more study hours tended to have higher exam scores.
Reporting correlation matrices
When a study includes several variables, researchers often report a correlation matrix. A matrix shows correlations among many pairs of variables in one table. It can be useful, but it should not replace explanation.
If one or two correlations are central to the research question, those results should also be described in the text. The table can hold the full set of values, while the prose guides the reader to the result that answers the question.
Writing with the right level of caution
A good report avoids both overstatement and unnecessary hesitation. It should not say that one variable caused the other unless the design supports that claim. It also should not hide a clear association behind vague wording.
For most correlational studies, phrases such as “was associated with,” “was positively correlated with,” or “tended to increase with” are accurate. They show the pattern without adding a causal claim that the test did not establish.
Conclusion
Correlation tests give researchers a structured way to examine association between two variables. They begin with paired data, calculate a coefficient, and evaluate whether the observed association provides evidence against a null hypothesis of no population correlation.
The main choice is not only whether to test a correlation, but which correlation test fits the data. Pearson’s test is suited to linear association between quantitative variables. Spearman’s test is suited to ranked or monotonic relationships. Kendall’s test reads rank agreement through concordant and discordant pairs. Each can be useful when it is matched to the research question and the measurement level.
The strongest interpretation combines the coefficient, p-value, confidence interval, assumptions, and study design. A significant result should not be turned into a causal claim without the right design. A non-significant result should not be treated as proof that no association exists. Read together, these pieces make correlation tests a careful way to reason about relationships in sample data.
Sources and Recommended Readings
If you want to go deeper into correlation tests, the following scientific publications provide useful discussions of Pearson, Spearman, Kendall, coefficient selection, interpretation, and reporting.
- Statistical reproducibility of correlation tests: Pearson, Spearman, and Kendall – A research article comparing the reproducibility of Pearson, Spearman, and Kendall correlation tests.
- Correlation Tests in R: Pearson Cor, Kendall’s Tau, and Spearman’s Rho – A Springer academic chapter focused on the three main correlation tests.
- Use of Pearson and Spearman correlation testing in Indian anaesthesia journals – A peer-reviewed article evaluating the use and interpretation of Pearson and Spearman correlation testing.
- Effective use of Spearman’s and Kendall’s correlation coefficients for association between two measured traits – A scientific article comparing rank-based correlation coefficients and their use.
- Pearson’s r, Spearman’s ρ, and Kendall’s τ – A statistics article discussing three widely used measures of correlation.
FAQs on Correlation Tests
What are correlation tests?
Correlation tests are statistical tests used to evaluate whether two variables are associated in a population, based on paired sample data. They usually report a correlation coefficient and a p-value.
What are the main types of correlation tests?
The main types of correlation tests are the Pearson correlation test, Spearman rank correlation test, and Kendall rank correlation test. Pearson is used for linear association between quantitative variables, while Spearman and Kendall are rank-based tests.
When should I use a Pearson correlation test?
Use a Pearson correlation test when you have two quantitative variables and want to test a linear association between them. A scatterplot should show that a straight-line summary is reasonable.
When should I use Spearman or Kendall correlation tests?
Use Spearman or Kendall correlation tests when the variables are ordinal, ranked, or related in a monotonic pattern rather than a clearly linear one. Kendall is often useful with smaller samples or many tied ranks.
Do correlation tests prove causation?
No. Correlation tests examine association between variables. They do not prove that one variable causes the other unless the research design and additional evidence support a causal interpretation.
How do you report a correlation test?
Report the test used, the two variables, the correlation coefficient, the sample size, and the p-value. When the correlation is central to the study, also report a confidence interval and interpret the result in plain language.


