Regression tests are statistical tests used to examine whether a regression model shows a meaningful relationship between an outcome variable and one or more predictor variables. In research, they help answer questions such as whether a predictor has a non-zero coefficient, whether several predictors improve a model, whether the model fits the data well enough, or whether the assumptions behind the analysis are reasonable.
This article explains what regression tests are, how they work, when to use them, which assumptions need attention, how to interpret results, and how a simple regression test can be reported in academic writing.
What are regression tests?
Regression tests are inferential procedures used with regression models. They ask whether a pattern found in sample data is strong enough to support a conclusion about a wider population or process. In a simple linear regression, this often means testing whether the slope of the regression line differs from zero. In multiple regression, it may mean testing whether one predictor is associated with the outcome after other predictors are included in the same model.
The word “test” can cause confusion because regression itself is also a modelling method. A researcher first fits a model, then uses one or more tests to evaluate parts of that model. The model estimates the relationship. The test evaluates whether the estimated relationship is large enough, relative to uncertainty, to be treated as evidence against a null hypothesis.
Regression test definition
A regression test is a statistical test that evaluates a hypothesis about a regression model, usually about a coefficient, a group of coefficients, the overall model, or a model assumption. The result is commonly reported with a test statistic, degrees of freedom, a p-value, and often a confidence interval for the estimated coefficient.
For example, suppose a researcher studies whether weekly study time predicts exam score. The regression model estimates how much the exam score changes, on average, for each additional hour of study. A regression test then asks whether that estimated slope could reasonably appear if the true slope in the population were zero.
Regression tests and regression analysis
Regression analysis is the broader modelling approach. It provides the equation, the fitted values, the residuals, and the estimated coefficients. Regression tests sit inside that analysis. They help the researcher decide whether the estimated pattern is likely to reflect more than random sample variation.
This connection is easiest to see in a fitted regression table. The table may show an intercept, a slope, a standard error, a t statistic, a p-value, and a confidence interval. The coefficient gives the estimate. The standard error shows the uncertainty around that estimate. The t statistic and p-value form the test. The confidence interval gives a range of plausible values for the population coefficient.
What regression tests can show
A regression test can show whether the data provide evidence that a coefficient differs from a stated value, usually zero. It can also compare nested models, examine whether several predictors jointly improve the model, or check whether the fitted model departs from an assumption such as constant residual variance.
The test does not prove that one variable causes another. A significant slope says that the predictor and outcome are statistically associated in the fitted model. Causal interpretation depends on the research design, how the variables were measured, whether relevant alternative explanations were handled, and how the sample was obtained.
Key aspects of regression tests
Regression tests become easier to follow when the main pieces are read together rather than memorised as separate terms. Imagine a study where a teacher records study hours and exam scores for a group of students. A scatterplot suggests that students who study longer tend to score higher. Regression turns that pattern into a fitted line, and the test asks whether the line’s slope provides evidence of a population relationship.
Several quantities work together in that one question. The coefficient describes the estimated slope. The standard error describes uncertainty in the estimate. The null hypothesis gives the reference claim. The test statistic compares the estimate with that reference. The p-value describes how unusual the result would be under the null hypothesis.
Outcome and predictor variables
The outcome variable is the variable the model tries to explain or predict. The predictor variable is used to explain variation in the outcome. In the study-hours example, exam score is the outcome and study time is the predictor. In a multiple regression, there may be several predictors in the same model.
The distinction is part of the model, not only part of the dataset. The same two variables could be arranged differently if the research question changes. A study of whether anxiety predicts sleep quality has one structure. A study of whether sleep quality predicts anxiety has another. The test follows the model that the researcher specifies.
Regression coefficient
A regression coefficient estimates the expected change in the outcome for a one-unit change in a predictor, while the rest of the model is held constant. In simple linear regression, the slope coefficient is the change in the fitted outcome for one unit of the predictor. In multiple regression, each coefficient is read after accounting for the other predictors included in the model.
Suppose the slope for study hours is 3.2. A plain interpretation would be: each additional hour of weekly study is associated with an estimated 3.2-point increase in exam score, on average, in this sample. The regression test then asks whether that estimated slope differs clearly enough from zero to support a population-level conclusion.
Null and alternative hypotheses
For a coefficient test, the null hypothesis usually states that the population coefficient equals zero. In words, the predictor has no linear association with the outcome in the model. The alternative hypothesis states that the coefficient differs from zero, or sometimes that it is greater than or less than zero if the direction was specified before the analysis.
For a slope, the hypotheses may be written as H0: β1 = 0 and Ha: β1 ≠ 0. The Greek letter beta refers to the population coefficient. The sample slope estimates that coefficient, but the test recognises that a sample estimate can vary from sample to sample.
Standard error and test statistic
The standard error tells the reader how much the coefficient estimate would be expected to vary across repeated samples, under the model conditions. A large coefficient with a large standard error may be less convincing than a smaller coefficient measured with high precision. This is why the test uses both the estimate and its uncertainty.
Coefficient test structure: t = estimated coefficient / standard error of the coefficient
When the null hypothesis states that the coefficient is zero, the t statistic is the estimate divided by its standard error. If the estimate is far from zero relative to its uncertainty, the absolute t value becomes larger. Statistical software then uses the t distribution and the model’s degrees of freedom to calculate the p-value.
p-value and confidence interval
The p-value is read under the null hypothesis. It tells us how unusual the observed test statistic, or a more extreme one, would be if the null hypothesis were true and the model conditions were satisfied. A small p-value suggests that the observed coefficient is difficult to explain under the null model.
A confidence interval gives a fuller view because it shows a range of plausible values for the population coefficient. If a 95% confidence interval for a slope runs from 1.4 to 5.0, then zero is outside the interval. That usually agrees with a statistically significant two-sided test at the 0.05 level. If the interval runs from -0.6 to 4.8, the result is less clear because zero remains a plausible value under that interval estimate.
How regression tests work
A regression test begins with a fitted model. The model may be simple, with one predictor, or more complex, with several predictors. Once the model is fitted, the researcher can test individual coefficients, test the whole model, or compare two models. Each test answers a different question, so the correct interpretation depends on the test that was chosen.
In the simplest case, the test compares an estimated slope with zero. If the slope is close to zero relative to its standard error, the evidence for a linear relationship is weak. If the slope is far from zero relative to its standard error, the evidence is stronger. The same logic extends to many regression settings, even when the test statistic changes from t to F, chi-square, or another form.
Testing one coefficient
The most common regression test in introductory statistics is the test for a single coefficient. In simple linear regression, this is often the slope test. In multiple regression, the same idea applies to each predictor. The test asks whether that predictor is associated with the outcome after the model has been specified.
For example, a researcher may model exam score from study time, attendance, and prior grade. The coefficient for study time is then tested while attendance and prior grade remain in the model. This does not make the result causal. It means the estimated association for study time is adjusted for the other predictors included in that specific model.
Testing the overall regression model
Many regression outputs also include an overall model test. In ordinary linear regression, this is often an F test. It asks whether the model with predictors explains more variation in the outcome than a model with no predictors. When there is only one predictor, the overall F test and the slope test usually lead to the same decision. With several predictors, they can tell different stories.
A model can have a significant overall F test while one individual predictor is not significant. That can happen when the predictors work together, when predictors overlap in the information they contain, or when one predictor has a large standard error. For this reason, the overall model test should not be read as proof that every predictor in the model is useful.
Comparing nested models
Regression tests can also compare nested models. One model is nested inside another when the smaller model can be created by removing one or more predictors from the larger model. The test asks whether the removed predictors improve the model enough to justify keeping them.
Suppose a researcher first fits a model using study time and attendance. A second model adds prior grade. A nested model test can examine whether adding prior grade improves the model beyond study time and attendance. In ordinary linear regression, this may be done with a partial F test. In some other regression models, likelihood ratio tests are often used.
Testing assumptions and model form
Some regression tests focus less on the main research hypothesis and more on whether the model form fits the data. Tests for heteroscedasticity examine whether residual spread changes across fitted values or predictors. Tests for lack of fit examine whether a straight-line model is too simple for the observed pattern. Tests for normality may be used in some contexts, although residual plots are often more informative than testing raw outcome values.
These tests should not be treated as automatic decorations. A diagnostic test answers a specific question about the model. It should be used when that question affects the interpretation or the choice of method. In many student projects, a residual plot, a scatterplot, and a clear explanation of the model assumptions will be more useful than a long list of diagnostic p-values.
From test output to research interpretation
The output of a regression test is statistical. The interpretation is research-based. A p-value can tell the reader whether the coefficient differs clearly from zero under the model. It cannot decide whether the estimated effect is large enough to be useful, whether the sample represents the target population, or whether the design supports a causal claim.
A careful interpretation usually combines the coefficient, confidence interval, p-value, model fit, and study context. For example, a slope of 0.2 points may be statistically significant in a very large sample, but it may be too small to have much practical meaning. A slope of 5 points may be non-significant in a small sample, yet still suggest a pattern worth examining with better data.
Assumptions
Regression tests rely on assumptions about the data, the model, and the sampling process. These assumptions do not require a perfect dataset. They ask whether the test is a reasonable tool for the question being asked. If the assumptions are badly mismatched, the p-values and confidence intervals may be misleading.
The exact assumptions depend on the regression model. Ordinary linear regression has a familiar set of assumptions about linearity, independence, residual spread, and residual behaviour. Logistic regression, Poisson regression, and other models have their own versions. This chapter focuses on the assumptions most often taught with linear regression tests.
Linearity
Linearity means that the relationship between a predictor and the outcome is reasonably represented by a straight-line pattern, at least within the range of the data being analysed. If the pattern is strongly curved, a single slope can give a poor summary. The test for that slope may then answer a question that the data never really asked.
A scatterplot is usually the first check. In multiple regression, residual plots and partial relationship plots can help. If the pattern is curved, the researcher may consider a transformed variable, a polynomial term, a spline, or a different model. The choice should follow the research question and the observed pattern, not only the p-value.
Independence of observations
Regression tests usually assume that observations are independent unless the model is designed for related data. Independence means that one observation does not directly determine or strongly depend on another. If several observations come from the same person, classroom, school, family, hospital, or repeated measurement session, ordinary regression may treat the data as more independent than they really are.
This can make standard errors too small and p-values too optimistic. When data are clustered or repeated, the analysis may need a mixed model, clustered standard errors, repeated-measures methods, or a design-specific approach. The main point is simple: the test should match the way the data were collected.
Constant variance of residuals
In ordinary linear regression, the residuals should have roughly similar spread across the range of fitted values. Residuals are the differences between observed outcomes and fitted outcomes. If the residuals spread out like a fan, the model may have heteroscedasticity, which means unequal residual variance.
Unequal variance does not always destroy the regression estimate, but it can affect standard errors, confidence intervals, and tests. Researchers may respond by using heteroscedasticity-robust standard errors, transforming the outcome, using weighted least squares, or choosing a model that fits the data structure better.
Normality of residuals
For ordinary linear regression tests, the normality assumption concerns the residuals, not the raw outcome variable and not every predictor. This point is often misunderstood. A skewed predictor does not automatically invalidate the regression test. The more relevant question is whether the residuals behave well enough for the inferential method being used.
With small samples, strong departures from residual normality can affect tests and intervals. With larger samples, regression tests are often more stable, although outliers and influential points still require attention. A histogram or Q-Q plot of residuals can be more informative than a normality test used mechanically.
No extreme influence from single observations
Some observations have unusual combinations of predictor and outcome values. These points can pull the regression line and change the coefficient, standard error, or p-value. The issue is not that an observation looks different. The issue is whether the result depends heavily on one or two cases.
Influential observations should be investigated, not removed automatically. They may be data entry errors, measurement problems, or genuine cases that reveal something important about the population. A responsible analysis explains how such cases were checked and whether the main result changes when they are handled differently.
Suitable measurement and sample design
Regression tests also depend on basic research design. The outcome should be measured in a way that fits the chosen model. The predictors should be meaningful for the research question. The sample should be suitable for the population claim. A technically correct test cannot fix weak data collection, unclear measurement, or a sample that does not match the intended conclusion.
This is where sampling and regression meet. A regression test may be calculated from any dataset, but population-level interpretation needs a defensible link between the sample and the population. Random sampling, stratified sampling, or another planned sampling method can support stronger inference than a dataset gathered only because it was convenient.
When to use regression tests
Regression tests are appropriate when the research question asks about a relationship between an outcome variable and one or more predictors. They are especially useful when the researcher wants to estimate the size and direction of an association, adjust for other predictors, or compare models that contain different sets of variables.
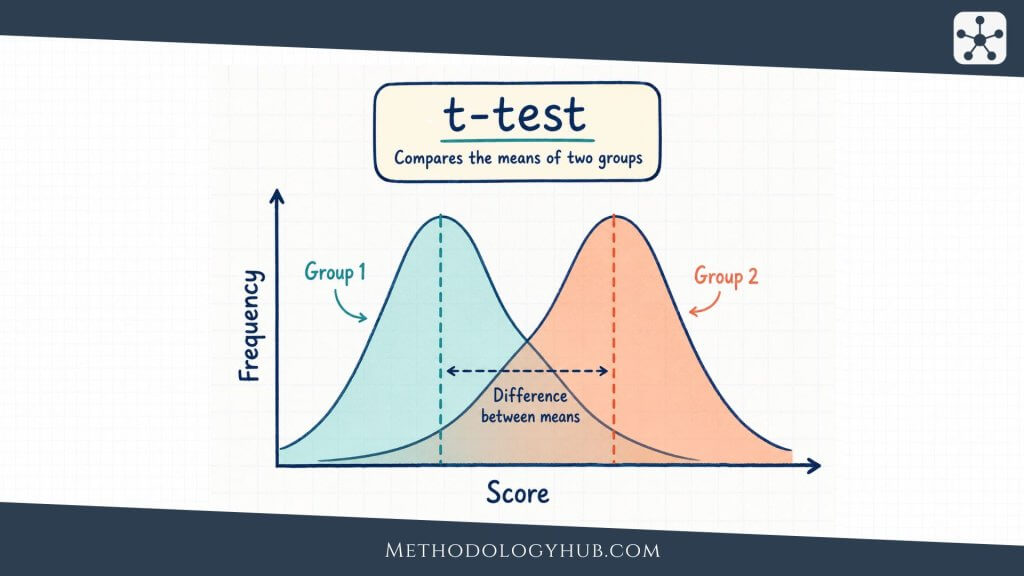
They are not the only option for studying relationships. A Pearson correlation coefficient may be enough when the question concerns the linear association between two quantitative variables and no outcome-predictor distinction is needed. A t-test may fit better when the aim is to compare two group means. ANOVA may fit a comparison of three or more group means. Regression becomes useful when the question is naturally model-based.
Use regression tests for prediction questions
Regression is often used when the researcher wants to estimate an outcome from one or more predictors. Prediction here does not have to mean forecasting the future. It can mean estimating reading score from vocabulary score, reaction time from age, or plant growth from light exposure.
A regression test can then examine whether the predictor contributes statistically to the model. The coefficient gives the direction and amount of estimated change. The test helps judge whether the estimate is clearly different from the null value under the model.
Use regression tests for adjusted associations
Regression is also useful when several predictors need to be considered together. For example, a researcher studying exam score may include study time, prior achievement, attendance, and class size. The test for study time is then interpreted while the other predictors are held in the model.
This type of adjustment can clarify an analysis, but it should not be oversold. If important predictors were not measured, or if the design does not support causal interpretation, an adjusted coefficient remains an adjusted association. The model can control for included variables, not for every possible explanation.
Use regression tests when group comparisons can be modelled
Some group comparisons can be written as regression models. A two-group comparison can be represented with a 0/1 indicator variable. A comparison of several groups can be represented with several indicator variables. This is one reason regression, t-tests, and ANOVA are closely connected.
For example, an independent-samples t-test comparing two group means can be expressed as a regression with one group indicator. A one-way ANOVA can be expressed as a regression with categorical predictors. Learning this connection helps students see that many statistical tests share the same underlying logic.
Use the right regression family
Ordinary linear regression is suitable when the outcome is quantitative and the relationship can reasonably be modelled with a linear structure. If the outcome is binary, such as pass or fail, logistic regression is usually more suitable. If the outcome is a count, such as number of absences, Poisson or negative binomial regression may be considered.
The phrase regression tests can therefore refer to more than one model family. In linear regression, coefficient tests are often t tests and model tests are often F tests. In logistic regression, coefficient tests may use z tests, Wald tests, likelihood ratio tests, or related methods. The interpretation changes with the model, so the test should always be named clearly.
Types of regression tests
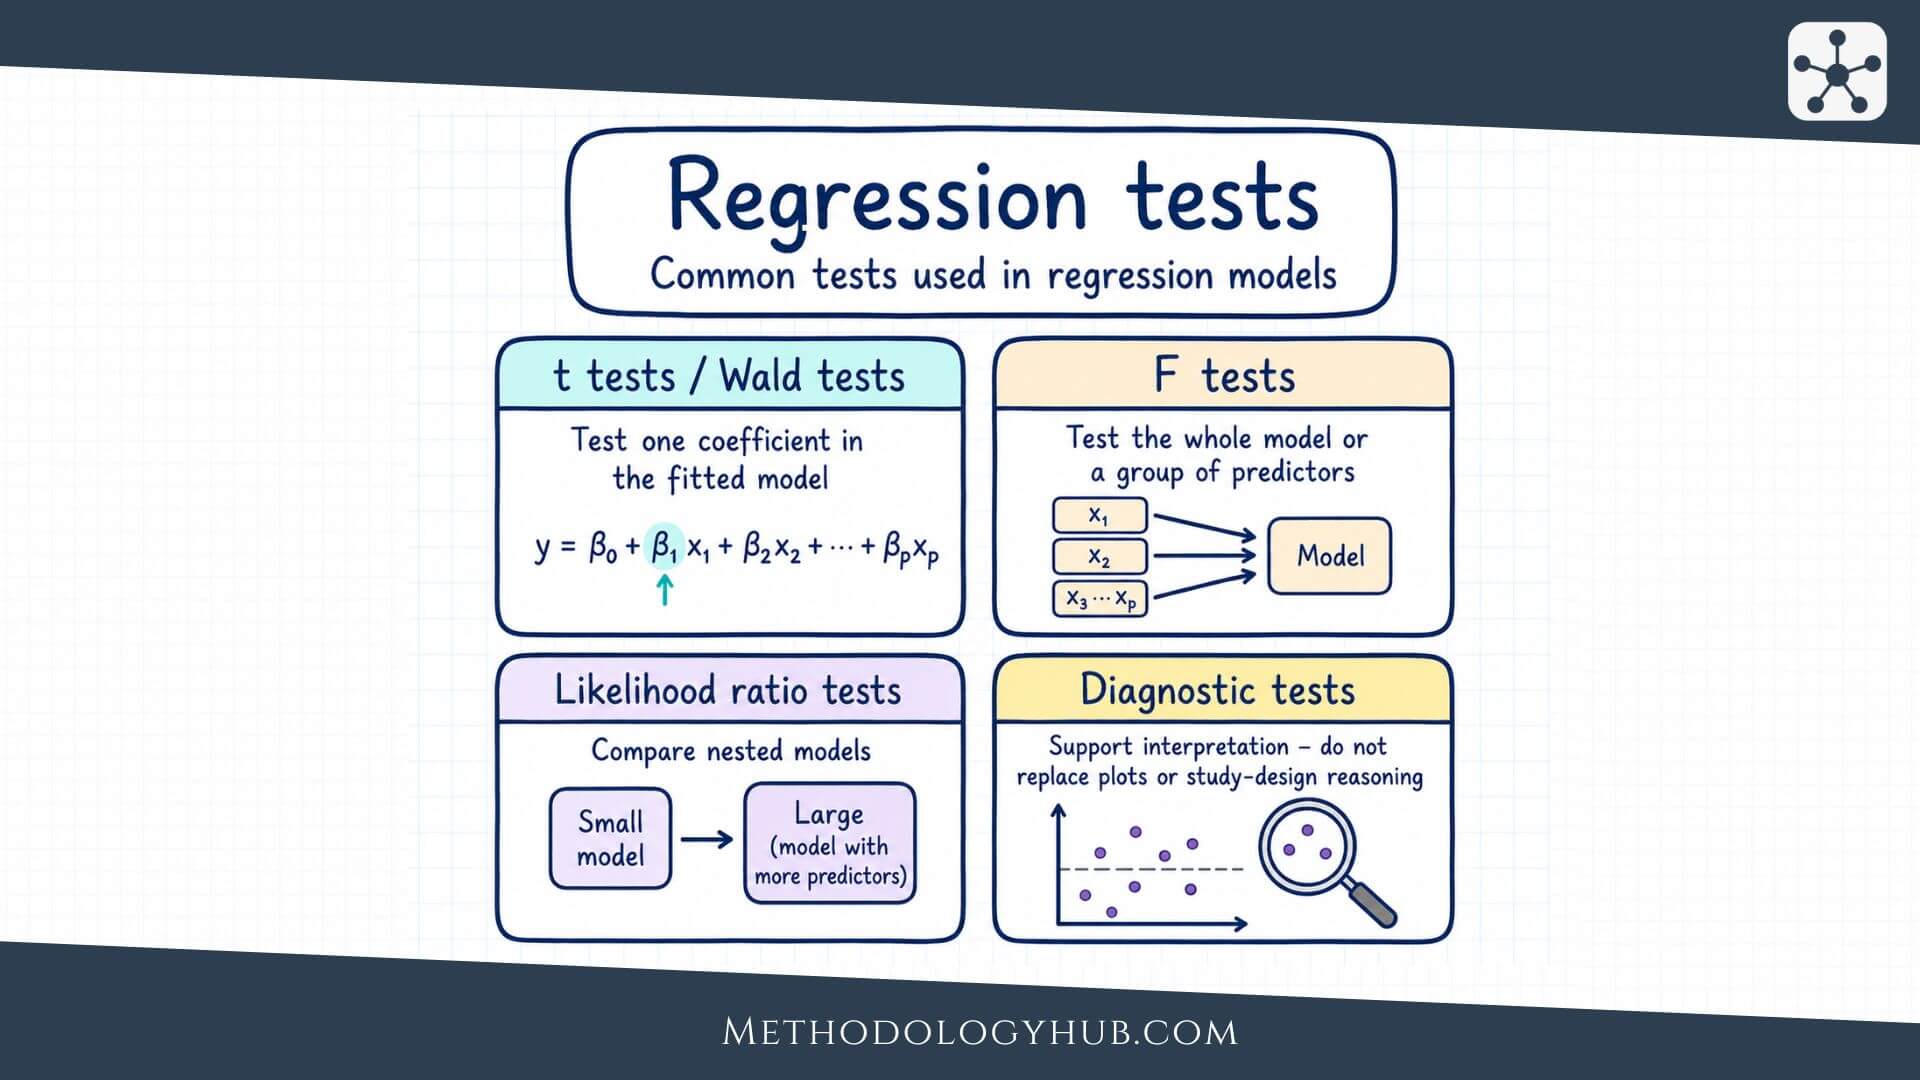
Regression testing is not a single calculation. It is a family of tests used for different parts of a model. Some tests focus on one coefficient. Others focus on the overall model, a set of predictors, a comparison between models, or a model assumption. Naming the test clearly helps the reader understand what was actually tested.
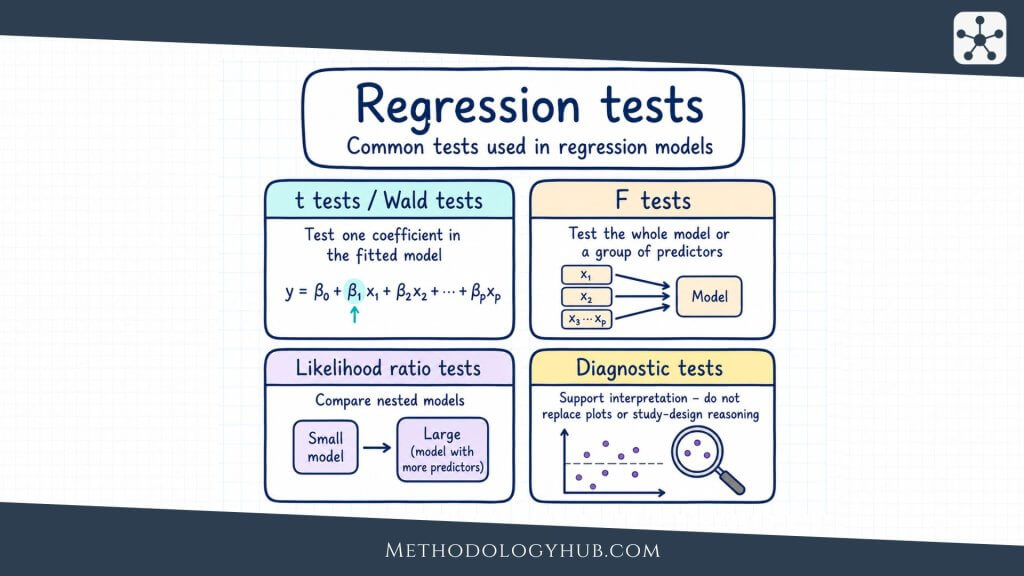
t tests for individual coefficients
In ordinary linear regression, an individual coefficient is often tested with a t test. The null hypothesis usually states that the coefficient equals zero. The test statistic is calculated by dividing the estimated coefficient by its standard error.
This test is common because it appears directly in regression output. Each predictor often has its own row, with a coefficient, standard error, t value, p-value, and confidence interval. A significant coefficient means the predictor is statistically associated with the outcome in that model. It does not mean the predictor is the most important variable, and it does not mean the model is complete.
F tests for overall models and groups of predictors
An F test is often used in linear regression to evaluate the model as a whole or to compare nested models. The overall F test asks whether the model with predictors fits better than a model with only the intercept. A partial F test asks whether adding a set of predictors improves the model beyond a smaller version.
This is useful when predictors belong together conceptually. For example, a researcher might add three indicator variables for school type and test them as a group. Testing each one separately may miss the broader question of whether school type improves the model at all.
Likelihood ratio tests
Likelihood ratio tests are common when comparing nested models in logistic regression and other generalized linear models. The idea is to compare how well two related models fit the data. If the larger model fits much better, the added predictor or set of predictors may be retained.
For example, a logistic regression model predicting whether students pass a course might first include study time and attendance. A larger model might add prior grade. A likelihood ratio test can examine whether the added variable improves the model enough to support the larger version.
Wald tests
A Wald test evaluates whether an estimated parameter differs from a null value, using the estimate and its standard error. In many regression outputs, especially for logistic regression, a Wald test appears for individual coefficients. It is similar in spirit to the t test used in ordinary linear regression.
Wald tests are convenient because they come directly from fitted model output. Still, they can behave less well in some small-sample or boundary cases. When in doubt, many researchers compare them with likelihood ratio tests or use methods recommended for the specific model and sample size.
Diagnostic regression tests
Diagnostic tests look at model conditions. They may examine heteroscedasticity, lack of fit, influential cases, nonlinearity, or residual behaviour. These tests are useful when they answer a specific concern raised by the model or plots.
For example, if a residual plot shows a fan-shaped spread, a heteroscedasticity test can support the decision to use robust standard errors. If a scatterplot suggests curvature, a lack-of-fit test or a comparison with a curved model may help. The diagnostic test should lead to a clearer analysis choice, not just add another number to the report.
| Regression testing question | Common test | Typical use |
|---|---|---|
| Does one coefficient differ from zero? | t test or Wald test | Testing one predictor |
| Does the model improve over an intercept-only model? | Overall F test | Linear regression model fit |
| Does a set of predictors improve the model? | Partial F test or likelihood ratio test | Comparing nested models |
| Is residual variance roughly constant? | Heteroscedasticity test | Checking standard errors and intervals |
| Is a straight-line form suitable? | Lack-of-fit or model comparison test | Checking model form |
Example usage
A worked example can make regression tests feel less abstract. Suppose a researcher wants to examine whether weekly study time predicts exam score among students in one course. The outcome variable is exam score. The predictor variable is study time in hours per week. The researcher fits a simple linear regression model.
The fitted model might be written as:
Example regression equation: predicted exam score = 58.4 + 3.1 x study hours
In plain language, the intercept is 58.4, and the slope is 3.1. The slope says that each additional study hour is associated with an estimated 3.1-point increase in exam score, on average, in this sample. The regression test asks whether the population slope could reasonably be zero.
Step 1: State the hypotheses
The null hypothesis states that the population slope is zero. The alternative hypothesis states that the population slope is not zero. Written symbolically, this is H0: β1 = 0 and Ha: β1 ≠ 0.
This is a two-sided test because the alternative allows either a positive or negative relationship. If the researcher had a strong, pre-specified reason to test only a positive relationship, a one-sided test could be considered. In most introductory reports, the two-sided version is easier to justify.
Step 2: Fit the model and read the coefficient table
Suppose the software output gives the slope as 3.1, the standard error as 0.8, the t value as 3.88, and the p-value as 0.001. The coefficient and standard error produce the t statistic. The p-value is then calculated from the t distribution with the model’s residual degrees of freedom.
| Predictor | Coefficient | Standard error | t | p |
|---|---|---|---|---|
| Study hours | 3.1 | 0.8 | 3.88 | 0.001 |
Step 3: Make the statistical decision
If the significance level is 0.05, the p-value of 0.001 is smaller than the decision threshold. The researcher rejects the null hypothesis that the population slope is zero. The result supports the conclusion that study time is statistically associated with exam score in the fitted model.
This decision should not be the whole interpretation. The slope estimate is still needed. The reader needs to know whether the relationship is positive or negative, how large it is, and how much uncertainty surrounds it.
Step 4: Interpret the result in context
A context-based interpretation might read as follows: In this sample, each additional hour of weekly study was associated with an estimated 3.1-point higher exam score. The coefficient test suggested that this slope differed from zero, t = 3.88, p = 0.001.
A fuller report would also include a confidence interval, the sample size, a measure of model fit such as R2, and a short note about assumption checks. If residual plots showed a strong curve or a few highly influential observations, the interpretation would need to mention that before the result receives too much weight.
Step 5: Connect the result to the study design
The example result does not show that studying caused higher scores unless the design supports that claim. Students who study more may also differ in prior knowledge, motivation, attendance, or access to support. A regression model can include some of these predictors if they were measured, but it cannot remove uncertainty from an observational design by itself.
A cautious conclusion would therefore say that study time was associated with exam score in the sample. If the study used random assignment to study-time conditions, strong measurement, and careful control of other factors, the interpretation could go further. The test result and the design should move together.
Interpretation of regression tests
Interpreting regression tests begins with the coefficient, not the p-value. The coefficient tells the reader what kind of relationship the model estimated. The p-value helps judge whether that relationship is statistically clear under the null hypothesis. The confidence interval shows the range of plausible coefficient values. Model fit and residual checks help decide whether the model summary is trustworthy.
A good interpretation therefore has several layers. It explains the direction of the relationship, the size of the estimated coefficient, the statistical evidence, the uncertainty, and the limits of the study design. Leaving out any of these pieces can make the result seem more certain or less informative than it really is.
Direction and size of the coefficient
The sign of a coefficient gives the direction. A positive coefficient means higher predictor values are associated with higher outcome values, assuming the model is specified in the usual way. A negative coefficient means higher predictor values are associated with lower outcome values. The size of the coefficient tells how much the fitted outcome changes for a one-unit change in the predictor.
Units matter here. A coefficient of 3.1 means something different if the outcome is exam points, minutes, kilograms, or a scale score. The predictor’s unit also shapes interpretation. A one-hour increase in study time is easy to read. A one-point increase on a complex scale may need a short explanation.
Statistical significance
Statistical significance means the test result passed the chosen decision rule, often p < 0.05. In a coefficient test, this usually means the estimated coefficient differs from zero strongly enough, relative to its standard error, to reject the null hypothesis.
Significance should be reported without exaggeration. A significant regression test does not mean the model is perfect, the predictor is causal, or the effect is large. It means the data provide evidence against the tested null hypothesis under the chosen model and assumptions.
Confidence intervals
Confidence intervals often make regression results easier to understand. A coefficient estimate of 3.1 with a 95% confidence interval from 1.5 to 4.7 suggests a positive association, with plausible values in that range. The interval communicates both direction and uncertainty.
If the interval is very wide, the estimate is imprecise. A wide interval may occur because the sample is small, the data are noisy, or the predictor does not vary much. In that case, even a coefficient that looks interesting should be interpreted carefully.
Model fit
Model fit describes how well the regression model summarises the outcome. In ordinary linear regression, R2 is often reported. It gives the proportion of variation in the outcome accounted for by the model in the sample. An R2 of 0.30 means the model accounts for 30% of the sample variation in the outcome.
R2 should not be confused with the coefficient test. A predictor can have a statistically significant coefficient in a model with low R2. A model can have a relatively high R2 while some individual predictors are not significant. The two quantities answer different questions.
Residual plots and interpretation
Residual plots show whether the fitted model leaves behind patterns. A random-looking residual plot supports the use of a simple model. A curved pattern may suggest that the relationship is not linear. A fan shape may suggest unequal variance. A few isolated points may suggest influential observations.
These plots help protect the interpretation from relying only on a table. A regression table may look tidy even when the model is not a good summary of the data. The plot shows whether the fitted line or fitted model has missed an important part of the pattern.
Reporting regression tests in academic writing
A compact academic report usually names the model, states the predictor and outcome, gives the coefficient and uncertainty, reports the test statistic and p-value, and explains the result in the study context. The wording should be specific enough that the reader knows which variable was associated with which outcome and in what direction.
For example: A linear regression was used to test whether weekly study time predicted exam score. Study time was positively associated with exam score, b = 3.1, SE = 0.8, 95% CI [1.5, 4.7], t(58) = 3.88, p = 0.001. This means that each additional study hour was associated with an estimated 3.1-point higher exam score, on average.
Regression tests vs correlation tests
Regression tests and correlation tests are closely related, but they frame the research question differently. A correlation test treats two variables symmetrically and asks whether they are associated. A regression test gives the variables different roles: one variable is the outcome, and one or more variables are predictors.
Correlation may be enough when the question is simply whether two quantitative variables move together. Regression is usually better when the researcher wants to estimate an outcome, adjust for other predictors, compare models, or interpret a slope in the units of the data. In simple linear regression with one quantitative predictor, the slope test and the Pearson correlation test are mathematically connected, but the wording of the result still differs.
Parametric and non-parametric approaches
Most introductory regression tests are parametric. They rely on a model with parameters, such as an intercept, slope, residual variance, and sometimes distributional assumptions. Ordinary linear regression t tests and F tests belong here. When the assumptions are reasonable, these tests are clear, familiar, and easy to report.
Non-parametric and robust approaches are useful when the standard model is not a good fit. A permutation test can build its reference distribution by rearranging the data under a null hypothesis. Rank-based regression tests can reduce dependence on some distributional assumptions. Robust standard errors can help when residual variance is unequal, because they adjust the uncertainty estimate used in the test.
These approaches are not interchangeable labels. Each one answers the regression question under a particular set of conditions. The report should therefore name the method clearly. Writing only “a regression test was conducted” is vague. A clearer statement would say “a linear regression coefficient test was conducted” or “a likelihood ratio test compared two nested logistic regression models.”
Conclusion
Regression tests help researchers evaluate hypotheses about regression models. They are used to test individual coefficients, overall models, groups of predictors, model comparisons, and sometimes assumptions. In the simplest linear regression setting, the test often asks whether the slope differs from zero. In broader regression settings, the same logic extends to multiple predictors, logistic models, nested models, and diagnostic checks.
The most useful interpretation starts with the research question and then moves through the coefficient, uncertainty, p-value, confidence interval, model fit, and assumption checks. A p-value alone is too thin. A coefficient without uncertainty is incomplete. A model without design context can be misleading. These pieces need to be read together.
For students and researchers, regression tests are best understood as part of a larger analysis. The test is not a replacement for looking at the data, checking the model, or explaining the result in plain language. It is a formal step that helps judge whether an estimated relationship is strong enough, given the uncertainty in the sample, to support an inferential claim.
FAQs on Regression Tests
What are regression tests?
Regression tests are statistical tests used to evaluate hypotheses about a regression model. They may test whether a coefficient differs from zero, whether a model improves prediction, or whether model assumptions are reasonable.
What is tested in a simple linear regression test?
In a simple linear regression test, the main test usually examines whether the slope differs from zero. A non-zero slope suggests that the predictor is statistically associated with the outcome in the fitted linear model.
What is the difference between regression tests and correlation tests?
Correlation tests examine whether two variables are associated without assigning outcome and predictor roles. Regression tests are used when one variable is treated as the outcome and one or more variables are used as predictors.
When should I use regression tests?
Use regression tests when your research question asks whether an outcome variable is related to one or more predictors, especially when you want to estimate the size of the relationship, adjust for other predictors, or compare regression models.
What assumptions are important for regression tests?
For ordinary linear regression tests, important assumptions include a suitable linear form, independent observations, roughly constant residual variance, reasonable residual behaviour, and no extreme influence from a few observations.


