Best Statistical Software in 2026: Free, Open Source, and Paid Compared
Best statistical software compared
This is a 2026 curated list of the best statistical software containing only highly regarded tools that are in active development and suitable for serious research, teaching, dissertation work, business analytics, or applied data analysis.
SAS
SAS Institute · since 1976SAS is statistical software developed in the USA by SAS Institute since 1976. It is developed for Windows, Linux, and cloud/server environments.
It is commonly used for enterprise analytics, data management, forecasting, survival analysis, multivariate modelling, reporting, and large-scale statistical workflows. It is especially relevant for clinical research teams, regulated industries, public-sector analysts, enterprise data departments, and organizations that need governed analytics. Its long institutional history makes it one of the most traditional names in statistical computing.
IBM SPSS Statistics
IBM · since 1968IBM SPSS Statistics is statistical software developed in the USA by IBM, with roots in the original SPSS project since 1968. It is developed for Windows, Mac, Linux, and cloud-connected workflows.
It is commonly used for social science research, survey analysis, institutional reporting, classification, data preparation, and menu-driven statistical procedures. It is especially relevant for universities, psychology departments, education researchers, healthcare analysts, and organizations that need a familiar graphical workflow. Its syntax layer also allows repeatable analysis beyond point-and-click use.
Stata
StataCorp · since 1985Stata is statistical software developed in the USA by StataCorp since 1985. It is developed for Windows, Mac, and Linux desktop environments.
It is commonly used for data management, econometrics, biostatistics, panel-data analysis, survey analysis, survival analysis, publication-ready graphs, and reproducible command-based research. It is especially relevant for economists, epidemiologists, policy researchers, political scientists, sociologists, and doctoral students who want a stable workflow with strong documentation. It combines a command language with menus, making it approachable while remaining suitable for advanced empirical research.
R
R Foundation / R Core Team · since 1993R is a statistical software environment originally developed in New Zealand by Ross Ihaka and Robert Gentleman and now stewarded by the R Foundation and the R Core Team since 1993. It is developed for Windows, Mac, Linux, and cloud/server environments.
It is commonly used for statistical computing, reproducible research, package-based modelling, data visualization, reporting, simulation, and teaching. It is especially relevant for researchers, statisticians, data scientists, epidemiologists, and academics who need an extensible open-source environment. Its package ecosystem makes it one of the most flexible choices for advanced statistical methods.
MATLAB
MathWorks · since 1984MATLAB is statistical software developed in the USA by MathWorks since 1984. It is developed for Windows, Mac, and Linux desktop environments.
It is commonly used for numerical computing, engineering statistics, simulation, matrix-based analysis, visualization, time series work, signal processing, and scientific programming. It is especially relevant for engineers, applied scientists, laboratory researchers, quantitative analysts, and university departments with technical computing curricula. It is broader than a pure statistics package and is often used where statistical analysis is part of a larger computational or engineering workflow.
Wolfram Mathematica
Wolfram Research · since 1988Wolfram Mathematica is statistical software developed in the USA by Wolfram Research since 1988. It is developed for Windows, Mac, Linux, and cloud notebook environments.
It is commonly used for statistical modelling, symbolic computation, numerical computation, visualization, simulations, algorithmic research, time series analysis, and interactive notebooks. It is especially relevant for mathematicians, physicists, computational scientists, engineers, educators, and researchers who need statistics alongside symbolic and numerical computation. Its notebook interface is useful when analysis, code, formulas, explanations, and visual outputs need to live in the same document.
Minitab
Minitab, LLC · since 1972Minitab is statistical software developed in the USA by Minitab, LLC since 1972. It is developed for Windows, Mac, and cloud workflows.
It is commonly used for quality improvement, Six Sigma, process capability, design of experiments, control charts, regression, forecasting, and guided statistical decision-making. It is especially relevant for manufacturing teams, quality engineers, operations researchers, business analysts, educators, and organizations standardizing process improvement. Its interface emphasizes guided procedures, which makes it practical for applied industrial statistics and non-programmer analysts.
JMP
JMP Statistical Discovery LLC · since 1989JMP is statistical software developed in the USA by JMP Statistical Discovery LLC, originally launched as a SAS product since 1989. It is developed for Windows and Mac desktop environments.
It is commonly used for interactive visual statistics, exploratory modelling, designed experiments, quality analysis, predictive modelling, and scientific discovery. It is especially relevant for scientists, engineers, quality teams, laboratory groups, and analysts who prefer visual exploration over purely command-based workflows. Its strength is the tight connection between statistical output and interactive graphics.
EViews
EViews / S&P Global · since 1994EViews is statistical software developed in the USA by Quantitative Micro Software, now part of S&P Global since 1994. It is developed for Windows and Mac desktop workflows.
It is commonly used for econometric analysis, forecasting, time series analysis, panel data, regression diagnostics, model estimation, and economic research. It is especially relevant for economists, finance researchers, central-bank analysts, policy analysts, and students working with macroeconomic or financial time series. It is particularly associated with applied econometrics and forecasting workflows.
OriginPro
OriginLab · since 1992OriginPro is statistical software developed in the USA by OriginLab since 1992. It is developed for Windows desktop environments.
It is commonly used for scientific graphing, curve fitting, regression, signal processing, laboratory data analysis, peak analysis, publication-quality charts, and technical reporting. It is especially relevant for laboratory scientists, physicists, chemists, engineers, materials researchers, and teams that place strong emphasis on graphical output. It is often selected when statistical analysis and publication-ready scientific plotting need to be tightly integrated.
Statgraphics
Statgraphics Technologies · since 1980Statgraphics is statistical software developed in the USA by Statgraphics Technologies since 1980. It is developed for Windows desktop environments.
It is commonly used for industrial statistics, quality control, design of experiments, regression, time series, statistical modelling, data visualization, and process improvement. It is especially relevant for quality professionals, industrial engineers, applied statisticians, operations teams, and training providers that need structured statistical procedures. Its emphasis on applied procedures makes it relevant for business, engineering, and production environments.
MedCalc
MedCalc Software Ltd · since 1993MedCalc is statistical software developed in Belgium by MedCalc Software Ltd since 1993. It is developed for Windows workflows, with Mac and Linux use cases represented through compatibility approaches in the source data.
It is commonly used for biomedical statistics, ROC curve analysis, method comparison, diagnostic test evaluation, regression, survival analysis, and clinical research graphs. It is especially relevant for medical researchers, clinicians, epidemiologists, biostatisticians, diagnostic laboratories, and healthcare organizations. Its interface and procedure set are particularly focused on medical and life-science applications.
gretl
The gretl team · since 2000gretl is statistical software developed in an international academic open-source context by the gretl team, including contributors associated with Wake Forest University and Università Politecnica delle Marche since 2000. It is developed for Windows, Mac, and Linux desktop environments.
It is commonly used for econometrics, regression modelling, time series analysis, forecasting, scripting, data handling, and open-source teaching in quantitative methods. It is especially relevant for economics students, econometrics instructors, applied researchers, and analysts who want a lightweight open-source alternative for empirical economic work. Its name stands for GNU Regression, Econometrics and Time-series Library, reflecting its focus on econometric workflows.
Python / SciPy stack
SciPy community / Python ecosystem · since 2001Python is used as statistical software in many ways through the SciPy ecosystem, developed by an international open-source community since 2001. It is developed for Windows, Mac, and Linux workflows.
It is commonly used for scientific computing, statistical workflows, notebooks, automation, visualization, numerical analysis, data preparation, and integration with libraries such as pandas, statsmodels, scikit-learn, and matplotlib. It is especially relevant for data scientists, computational researchers, engineers, and analysts who need statistics inside a broader programming environment. Its flexibility is high, but many statistical capabilities depend on the selected library stack.
JASP
JASP Team / University of Amsterdam · since 2015JASP is statistical software developed in the Netherlands by the JASP Team with support from the University of Amsterdam since 2015. It is developed for Windows, Mac, Linux, and browser/cloud workflows.
It is commonly used for accessible frequentist statistics, Bayesian statistics, teaching, transparent output, reproducible analysis, and graphical statistical reporting. It is especially relevant for students, instructors, psychology researchers, social scientists, and users who want a modern free interface without writing code. It is often positioned as an approachable alternative for teaching statistics while still offering advanced Bayesian options.
jamovi
The jamovi project · since 2017jamovi is statistical software developed in an international open-source context, commonly cited with Sydney, Australia for publication purposes by the jamovi project since 2017. It is developed for Windows, Mac, Linux, and cloud workflows.
It is commonly used for introductory statistics, teaching, descriptive analysis, common inferential procedures, clean output tables, and accessible GUI-based statistical learning. It is especially relevant for students, instructors, psychology departments, social science programs, and users moving from spreadsheets into formal statistical analysis. It is built on top of the R statistical language, giving users a friendly interface while retaining links to the broader R ecosystem.
Orange
University of Ljubljana / Orange community · since 1996Orange is statistical software developed in Slovenia by the University of Ljubljana and the Orange community since 1996. It is developed for Windows, Mac, and Linux desktop environments.
It is commonly used for visual data mining, exploratory analysis, classification, clustering, regression workflows, visualization, educational machine learning, and no-code analytical pipelines. It is especially relevant for data mining instructors, students, analysts, researchers, and teams that want visual workflows instead of script-first analysis. Its widget-based canvas is useful for demonstrating analytical pipelines and machine-learning concepts.
StatCrunch
Pearson Education · since 1997StatCrunch is statistical software developed in the USA by Pearson Education since 1997. It is developed for browser-based cloud workflows across Windows, Mac, and Linux devices.
It is commonly used for introductory statistics education, classroom datasets, descriptive statistics, regression, charts, interactive exploration, and browser-based student analysis. It is especially relevant for students, instructors, online courses, textbook-based learning environments, and users who need lightweight statistical tools in a browser. Its educational focus makes it more suitable for learning and teaching than for large-scale professional statistical programming.
GNU PSPP
GNU Project · since 1998GNU PSPP is statistical software developed in the global GNU free-software community by the GNU Project since 1998. It is developed for Windows, Mac, and Linux desktop environments.
It is commonly used for sampled data analysis, SPSS-like syntax, descriptive statistics, data transformation, basic modelling, reliability analysis, and open-source teaching contexts. It is especially relevant for educators, students, researchers with simple survey-style datasets, and users seeking a free software alternative inspired by SPSS workflows. It is lighter in scope than many commercial packages, but it is useful for transparent and accessible statistical instruction.
No matching software
Try clearing one or more filters, or use a broader search term.
About Statistical Software

Statistical software is part of the research method, not just a tool opened after the study is finished. The choice affects how data are cleaned, which tests are easy to run, how graphs are produced, how results are checked, and how transparent the final analysis can be. A student writing a dissertation, a psychologist analysing survey data, an epidemiologist fitting survival models, and an engineer working with signal data may all need statistics, but they may not need the same software.
The table above gives a compact view of familiar programs such as SPSS, JMP, Stata, SAS, R, and MATLAB. The article below expands that comparison by looking at interface, learning curve, data manipulation, statistical coverage, graphics, discipline fit, free alternatives, and reporting practice. The aim is not to declare one universal winner. A better question is which statistical software fits the way the data were collected, the analysis that has to be defended, and the level of reproducibility expected from the work.
- Statistical Analysis - Learn how statistical analysis organises, examines, and interprets research data.
- Statistical Methods - Compare the main methods used for description, inference, modelling, and prediction.
- Inferential Statistics - See how researchers move from sample data to wider conclusions.
- Hypothesis Testing - Learn how sample data are used to evaluate claims about populations.
What is statistical software?
Statistical software is a program, programming environment, or web platform used to prepare data, calculate statistical results, and present analytical output. It may be menu-driven, code-based, notebook-based, browser-based, or a mixture of these formats. Some programs are built around a graphical interface. Others expect the user to write commands. A few, such as R and Python-based workflows, are less like a single statistics package and more like an environment where packages are added as the research problem becomes more specific.
This difference changes the experience of analysis. In SPSS, JASP, jamovi, or Minitab, many users begin by selecting procedures from menus. In Stata or SAS, menus exist, but serious work often depends on syntax or scripts. In R and Python, the analysis is usually expressed as code from the beginning. MATLAB and Mathematica sit between statistics and broader scientific computing, which makes them useful when statistical analysis is only one part of a numerical or simulation workflow.
Statistical software as part of the research workflow
The software choice should appear earlier than many students expect. It influences data structure, file formats, variable coding, missing-value handling, graph design, and the way results are repeated later. A questionnaire dataset that looks simple in a spreadsheet may become difficult if categorical responses, repeated measurements, or derived scales are not coded consistently. A longitudinal clinical dataset may need survival analysis, date handling, and careful documentation of exclusions. A time-series project may need procedures that are weak or absent in a basic teaching package.
For that reason, statistical software is not only about which buttons are convenient. It is also about whether the tool can express the research design accurately. A program may be easy to start but limiting for advanced models. Another may be difficult for beginners but much stronger once the analysis becomes repetitive, scriptable, and auditable.
Menu-driven software is often easier for first analyses. Code-based software is usually stronger when the analysis must be repeated, checked, modified, or shared.
General-purpose and specialised tools
Some statistical software is general-purpose. R, Stata, SAS, SPSS, and Python can be used across many fields. Others are associated with a narrower style of work. Minitab and JMP are often used in quality improvement, experiments, and industrial statistics. EViews and gretl are closely tied to econometrics and time series. MedCalc is shaped around biomedical analysis, diagnostic tests, ROC curves, and survival procedures. Orange is more visual and is often used for teaching data mining and machine learning workflows.
A narrow tool is not automatically weaker. It may simply be designed around a specific type of question. The problem begins when a researcher uses a familiar program for a design it handles poorly. In that situation, the analysis may become awkward, undocumented, or dependent on manual workarounds.
- Statistical software includes both programs and environments used to prepare, analyse, and present data.
- The interface affects the workflow, especially the difference between menu-driven analysis and scripted analysis.
- Software should fit the research design, not only the user's first impression of ease.
- Specialised tools can be strong choices when their procedure set matches the study.
Comparison of statistical software
A comparison of statistical software becomes clearer when the categories are practical. Interface, learning curve, data manipulation, statistical analysis, graphics, and specialisation tell the user more than a simple list of software names. The table above follows this logic. SPSS and JMP give users menus plus syntax. Stata is strongly syntax-oriented while still offering menus. SAS and R have steeper learning curves because serious use depends heavily on command-based work. MATLAB is also code-oriented, but its strength is broader numerical and engineering work rather than only statistical procedures.
The differences are not only about comfort. They shape the kinds of analyses that become natural. SPSS is approachable for surveys, custom tables, ANOVA, and multivariate procedures, especially in social science teaching. JMP is strong when visual exploration, design of experiments, model fit, and quality control are central. Stata is well suited to panel data, survey data, mixed models, epidemiology, and econometrics. SAS remains common in regulated and institutional settings where large datasets, reporting systems, and governed workflows are part of the analysis. R is extremely versatile because packages extend it into graphics, machine learning, Bayesian analysis, time series, survival analysis, and specialised modelling. MATLAB is often chosen when statistics is combined with simulation, multidimensional arrays, image processing, or signal processing.
| Software | Best fit | Main caution |
|---|---|---|
| SPSS | Survey data, social sciences, teaching, common statistical tests. | Point-and-click work can become hard to reproduce unless syntax is saved. |
| JMP | Interactive graphics, experiments, quality analysis, visual exploration. | Less familiar in some academic departments than SPSS, Stata, R, or SAS. |
| Stata | Econometrics, biostatistics, panel data, survey data, reproducible empirical work. | The workflow rewards learning syntax rather than relying on menus. |
| SAS | Large datasets, reporting, clinical research, regulated institutional analysis. | The learning curve and cost can be high for independent students. |
| R | Advanced modelling, graphics, reproducible research, open-source analysis. | Beginners must learn packages, syntax, data objects, and error messages. |
| MATLAB | Simulation, matrices, engineering statistics, image and signal workflows. | It is broader than a statistics package, so some standard research workflows may need toolboxes. |
The software catalogue on this page adds further options beyond the six programs shown in the comparison image. Minitab, OriginPro, Statgraphics, and MedCalc fit applied fields where guided procedures and specific outputs are important. JASP and jamovi are easier open-source choices for students who want a modern interface. gretl is useful for econometrics teaching. Python and the SciPy stack suit users who need statistics inside a wider programming workflow. Orange is helpful when the analysis is visual and exploratory.
How to choose a statistical software
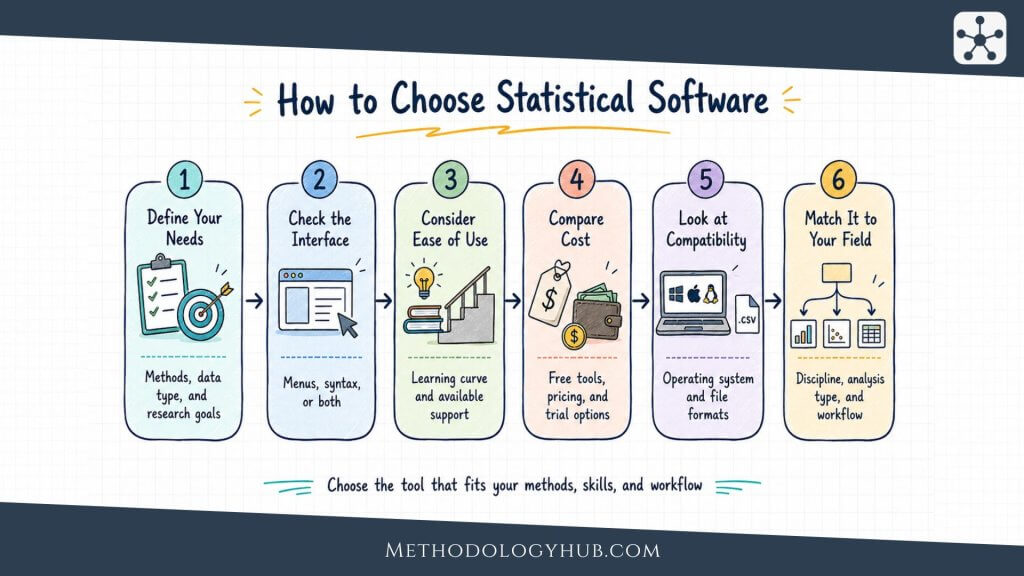
Choosing statistical software begins with the study, not with the software menu. A researcher should first ask what the data look like, what the research question requires, and how the result will be checked later. A small cross-sectional survey with basic group comparisons can be handled by many tools. A panel dataset, a multilevel model, a survival analysis, a complex survey design, or a simulation study narrows the field quickly.
The first practical question is interface. A menu-driven interface can be helpful when learning statistics or when the analysis contains a limited number of familiar procedures. It reduces the burden of remembering syntax and makes output visible quickly. The trade-off is that the workflow can become difficult to audit if the user does not save syntax, logs, or a clear record of each step. A code-based workflow takes longer to learn, but it leaves a written trace. That trace becomes useful when a supervisor asks how a variable was recoded, when a reviewer asks for a sensitivity analysis, or when the researcher returns to the project months later.
Match the software to the analysis plan
The analysis plan should guide the shortlist. For descriptive statistics, t-tests, ANOVA, simple regression, and standard plots, many tools are enough. For survival analysis, mixed models, panel data, Bayesian models, complex survey weights, time series, or machine learning, the choice becomes more specific. The researcher should check not only whether a method exists in the software, but whether it is documented, actively maintained, and accepted in the field.
Data manipulation is another part of the decision. Some projects require only light cleaning. Others need reshaping, merging, date handling, text processing, repeated-measure structures, or repeated data imports. R, Python, SAS, and Stata are strong when the dataset has to be transformed many times. SPSS can manage many standard data tasks, but scripted habits become important when transformations should be reviewed. MATLAB is strong with matrices and technical data. JMP and Minitab are useful when data cleaning and analysis are closely linked to visual inspection.
- list the statistical procedures needed for the study
- check whether the dataset needs heavy reshaping or repeated cleaning
- decide whether the analysis must be reproduced from saved code
- check whether your department, supervisor, or field expects a specific tool
Consider cost, access, and long-term use
Price should be separated from source model. Proprietary software may be excellent, but the user depends on licences, institutional access, and version availability. Open-source software is free to install, but the cost appears in learning time, documentation habits, and package selection. For a short course, an easy interface may be more important than unlimited extension. For a dissertation or thesis that may grow over several years, scriptable and widely available tools can prevent later problems.
Operating system support also affects ordinary practical work. A student using a Mac, a lab using Windows, and a research group using Linux servers may not have the same options. Cloud tools can reduce installation problems, but they raise questions about internet access, data protection, and file control. The best choice is often the one that lets the researcher complete the planned analysis without creating avoidable obstacles for review, supervision, or replication.
- Start with the research question and the planned analysis, rather than with the most familiar program.
- Check data manipulation needs, because cleaning and reshaping often take more time than the final test.
- Menu-driven tools are useful for access, while scripts make the analysis easier to review.
- Cost, operating system, and licence access should be considered before the project depends on one tool.
Statistical software by disciplines

Different disciplines develop habits around particular tools. These habits are partly historical and partly practical. A program becomes common because teachers use it, textbooks refer to it, published examples use it, or professional settings expect it. A beginner does not have to follow those habits blindly, but they should know them. A dissertation is easier to supervise when the software is familiar to the department. A research article is easier to review when the analysis is reported in a form readers recognise.
Social sciences and education
SPSS remains common in psychology, education, sociology, and survey-based teaching because the interface is approachable and the output is familiar. It handles descriptive statistics, crosstabs, t-tests, ANOVA, regression, factor analysis, reliability analysis, and many multivariate procedures. JASP and jamovi have become attractive alternatives for teaching because they are free, modern, and easier to install. R is increasingly common when courses want reproducible scripts or advanced graphics, but the first weeks can be harder for students who are also learning statistics.
Economics, public policy, and political science
Stata is a strong fit for empirical social science where regression, panel data, survey data, and reproducible do-files are central. It offers a disciplined command structure and extensive documentation. gretl can be a good open-source tool for econometrics courses, especially when the aim is to teach regression, time series, and scripting without licence costs. R is also widely used in economics and policy research when users need packages for visualisation, text analysis, Bayesian modelling, or simulation.
Medicine, epidemiology, and clinical research
Medical and health researchers often encounter SAS, Stata, SPSS, R, MedCalc, GraphPad Prism, and specialised packages. SAS is common in regulated clinical workflows and large institutional datasets. Stata is widely used in epidemiology and public health. R is strong for reproducible analysis, packages, and modern reporting. MedCalc is useful for biomedical statistics, ROC curves, diagnostic test evaluation, method comparison, and survival analysis. The choice should also reflect reporting expectations, since journals may expect software name, version, packages, and analysis details.
Engineering, laboratory, and scientific computing
MATLAB, Mathematica, OriginPro, JMP, Minitab, and Python often appear in technical fields. MATLAB is strong when data analysis is tied to simulation, signal processing, image processing, or matrix operations. OriginPro is often used when publication-quality scientific graphs and curve fitting are central. JMP and Minitab fit design of experiments, quality control, and process analysis. Python is useful when statistical work is part of a larger computational system, data pipeline, or modelling workflow.
Discipline fit: A tool that is excellent in one field may be awkward in another. The question is not only what the software can calculate, but how naturally it fits the data, reporting style, and training culture of the discipline.
Teaching contexts add another layer. A first statistics course may benefit from a clear interface that lets students focus on interpretation. A methods course for doctoral students may need syntax because the analysis must be documented. A lab course may need graphs, data import, and repeated templates. A computational course may choose R or Python because students need to understand the full workflow from data to output.
- Social sciences often use SPSS, JASP, jamovi, R, and Stata depending on course level and analysis depth.
- Economics and policy research often use Stata, R, and gretl for regression, panel data, and time series.
- Medical and clinical research often uses SAS, Stata, R, SPSS, and MedCalc depending on regulation and method.
- Engineering and laboratory work often uses MATLAB, Python, OriginPro, JMP, or Minitab when analysis is tied to technical data.
Best free statistical software
Free statistical software is not a single category. Some tools are open-source programming environments. Others are graphical interfaces built for teaching. Some are broad enough for research, while others are better for introductory work. The best free statistical software depends on whether the user needs advanced methods, a friendly interface, reproducible code, or discipline-specific procedures.
R
R is the strongest free option for many academic researchers because it combines statistical depth with an enormous package ecosystem. It is especially strong for modelling, graphics, simulation, reporting, and specialised methods. The limitation is the learning curve. Users have to understand packages, objects, functions, and scripts. Once those pieces are familiar, R becomes one of the most flexible statistical environments available.
Python and the SciPy stack
Python is useful when statistics sits inside a broader programming workflow. With pandas, NumPy, SciPy, statsmodels, scikit-learn, matplotlib, and related libraries, it can handle data preparation, modelling, visualisation, machine learning, and automation. It is a strong choice for computational research, but users may need to combine several libraries to get the range of statistical procedures that a dedicated package offers in one place.
JASP and jamovi
JASP and jamovi are good free choices for students, instructors, and researchers who want an interface without starting from code. Both are especially useful for common statistical designs, teaching, and clean output. JASP has strong Bayesian options. jamovi is built around R and can connect users gradually to the R ecosystem. They are not replacements for every advanced workflow, but they make many standard analyses accessible.
gretl, GNU PSPP, and Orange
gretl is a strong free choice for econometrics and time series teaching. GNU PSPP is a free SPSS-like option for basic sampled-data analysis and syntax-based teaching. Orange is useful for visual data mining, classification, clustering, and machine-learning demonstrations. These tools work well when their design matches the study. They are less suitable when the project needs a method outside their main procedure set.
| Free software | Good fit | Learning curve |
|---|---|---|
| R | Advanced statistics, graphics, reproducible research. | Hard at first. |
| Python | Programming, data pipelines, machine learning, automation. | Moderate to hard. |
| JASP | Teaching, common tests, Bayesian options. | Easy. |
| jamovi | Introductory statistics and clean GUI output. | Easy. |
| gretl | Econometrics, regression, time series. | Moderate. |
| Orange | Visual data mining and machine-learning teaching. | Easy to moderate. |
Reporting statistical software in research
After the software has been chosen, it still has to be reported clearly. Many methods sections mention only the program name, but that is often incomplete. Different versions can change default settings, procedures, numerical algorithms, graphics, or package behaviour. In code-based environments, package names and package versions can be as important as the software itself. In menu-driven programs, the selected options may need to be described because the output does not always reveal every decision.
A clear methods section usually reports the software name, version, publisher or project, operating environment when relevant, and packages or modules used for major procedures. For example, an R analysis should normally name R and important packages. A Stata analysis should report the Stata version and user-written commands when they shape the result. An SPSS analysis should report the version and the main procedures. A SAS analysis may need the version, modules, and relevant procedures.
Reproducibility and analysis records
Reproducibility does not require every reader to use the same machine, but it does require enough information to understand how the result was produced. Saved syntax, scripts, logs, notebooks, or well-documented output files help protect the analysis from accidental changes. They also make supervision and peer review easier. A dataset can be cleaned once and then re-cleaned automatically from the raw file, rather than rebuilt by memory.
This is one reason scriptable software has become so important in research. It does not remove the need for judgement, but it records that judgement. Code can show how missing values were set, how groups were combined, how scales were computed, and which model was fitted. Menu-driven software can also be reproducible when syntax is saved and procedures are documented. The problem is not the interface itself. The problem is undocumented clicking.
- software name and version
- packages, modules, or user-written commands used for main analyses
- important settings, options, or defaults that affect results
- how data cleaning and transformations were documented
Choosing with reporting in mind
A researcher who knows that a project will be reviewed, audited, or extended should choose software that makes records easy to keep. This does not always mean choosing the hardest tool. A supervised undergraduate project may be better served by JASP, jamovi, or SPSS with saved output and clear procedure descriptions. A doctoral project with repeated data processing may need R, Stata, SAS, or Python. A laboratory project may need MATLAB or OriginPro if graphs, signal processing, and fitted curves are part of the evidence.
The final report should make the software visible without letting it replace statistical reasoning. Reporting the program does not prove that the correct method was used. The researcher still has to explain the variables, sample, assumptions, model choice, and interpretation. Software carries out the calculation. The methods section explains why that calculation fits the study.
- Report more than the software name when versions, packages, modules, or settings affect the result.
- Saved scripts, syntax, logs, and notebooks make the analysis easier to check later.
- Menu-driven software can still be documented well if the user saves syntax and records choices.
- Software reporting supports transparency, but it does not replace explanation of the statistical method.
Conclusion
Statistical software should be chosen with the same care as a statistical test. The software affects the data workflow, the methods available, the graphs produced, the ease of revision, and the transparency of the final report. A familiar interface can be useful, especially in teaching and early analysis. A scriptable workflow can be better when the project is long, complex, or expected to be reproduced.
For many users, the best answer is not one program forever. A student may begin with JASP or jamovi, move to SPSS or Stata in a methods course, and later use R or Python for a thesis. A medical researcher may use MedCalc for diagnostic analyses and R for reporting. An engineer may use MATLAB for signal workflows and R for statistical graphics. The important point is to choose deliberately. The software should fit the data, the discipline, the analysis plan, and the evidence the researcher needs to present.
- There is no single best statistical software for every research project.
- The strongest choice depends on data structure, methods, discipline, interface, and reproducibility needs.
- Free tools such as R, Python, JASP, jamovi, gretl, PSPP, and Orange can be excellent when they fit the analysis.
- The methods section should report the software clearly, especially versions, packages, modules, and important settings.
Sources and Recommended Readings
If you want to go deeper into statistical software, the following scientific publications and academic reference works discuss software choice, use, accessibility, reporting, development, and field-specific applications.
- Statistical Software (R, SAS, SPSS, and Minitab) for Blind Students and Practitioners - A Journal of Statistical Software review focused on accessibility across several major statistical packages.
- Statistical software applications used in health services research: analysis of published studies in the U.S - A BMC Health Services Research article on statistical software use in health services research.
- Statistical Software Use in Canadian University Courses: Current Trends and Future Directions - A Teaching of Psychology article on which software appears in Canadian university statistics courses.
- Sem: a suitable statistical software adaptated for research in oncology - A PubMed-indexed article on statistical software designed for oncology research workflows.
- Statistical Software Usability for Novice Research Students in the Social Sciences: An Eye-Tracking Study - A statistics education article on how novice research students interact with statistical software.
FAQs on Statistical Software
What is statistical software?
Statistical software is a program, programming environment, or web platform used to prepare data, run statistical analyses, create graphs, and produce output for research, teaching, or applied data analysis.
Which statistical software is best for beginners?
Beginners often find JASP, jamovi, SPSS, Minitab, or JMP easier because they provide graphical interfaces. The best choice depends on the course, research question, available licence, and whether the analysis needs to be reproduced later with saved syntax or code.
What is the best free statistical software?
R is usually the strongest free general-purpose statistical software for advanced research. JASP and jamovi are easier free options for common statistical tests and teaching. Python is useful when statistics is part of a wider programming or data-processing workflow.
Is R better than SPSS?
R is more flexible, free, and highly extensible, but it has a steeper learning curve. SPSS is easier for many beginners and remains common in social science teaching. R is often better for reproducible and advanced work, while SPSS can be better for accessible menu-driven analysis.
Which statistical software is used in academic research?
Academic researchers commonly use R, SPSS, Stata, SAS, Python, MATLAB, JMP, Minitab, MedCalc, JASP, and jamovi. The choice varies by discipline, method, licence access, supervisor preference, and the level of reproducibility expected from the project.
How should statistical software be reported in a paper?
A paper should usually report the software name, version, relevant packages or modules, and important settings that affect the analysis. Code-based work should also document scripts or notebooks when possible, especially if the analysis needs to be reproduced.
Free Statistical Tools
Correlation Coefficient Calculator
Measure the strength and direction of relationships between variables with clear, easy-to-read results. Useful for exploratory analysis, hypothesis testing, and reporting findings.
Effect Size Calculator (Cohen's d)
Calculate effect size quickly to understand the practical magnitude of differences between groups. Ideal for research reports, study interpretation, and comparing results beyond p-values.
Linear Regression Calculator
Analyze how variables predict an outcome using straightforward regression outputs. Helpful for modeling trends, testing hypotheses, and interpreting statistical relationships.
Sample size calculator
Estimate the sample size needed for your study based on key statistical inputs. A practical tool for planning experiments, surveys, and research designs with adequate power.