Research data is the material collected, created, observed, or reused during a research project so that a question can be examined in a careful and transparent way. It may look like numbers in a spreadsheet, interview transcripts, field notes, or annotated texts. What gives it research value is not only its format, but also the way it is connected to a research question, a method, and a process of analysis.
This article explains what research data is, how it differs from information, how major data categories relate to one another, and how data can be collected.
What Is Research Data?
Research data is any recorded material that is collected, produced, or used to answer a research question. It can be generated directly by the researcher, taken from an existing archive, extracted from a database, observed in the field, measured in a laboratory, or produced through interaction with participants. In simple terms, it is the material that allows research to move from a question to an answer that can be checked, discussed, and built upon.
A useful definition has to stay broad because different disciplines work with very different kinds of material. In sociology, research data may include interview transcripts, questionnaire responses, demographic records, or observations from a classroom. In chemistry, it may include instrument readings, spectra, reaction yields, and laboratory notebooks. In history, it may include letters, census records, photographs, newspapers, or catalogued archival sources. In medicine, it may include clinical measurements, imaging files, lab test values, treatment records, and patient-reported outcomes.
That variety can make the term feel larger than it really is. The easiest way to understand it is to connect data to a research purpose. A photograph is not automatically research data. It becomes research data when it is collected or analysed as evidence for a research question. The same is true of a number, a sentence, a recording, or a table. The item itself is only part of the story. Its role in the study gives it meaning.
Key Characteristics of Research Data
Research data has several characteristics that make it useful for academic work. It should be connected to a research question, gathered through a method, described well enough for others to understand, and handled in a way that preserves its meaning. Data without context is often difficult to interpret. A list of numbers may look precise, but without knowing what was measured, how it was measured, when it was recorded, and under what conditions, the list remains incomplete.
Good research data is usually described through metadata. Metadata is information about the data, such as the creator, date, method, variables, units, instruments, source, file format, sampling method, coding system, or access conditions. This extra information helps readers understand how the data was produced and how far it can reasonably be used.
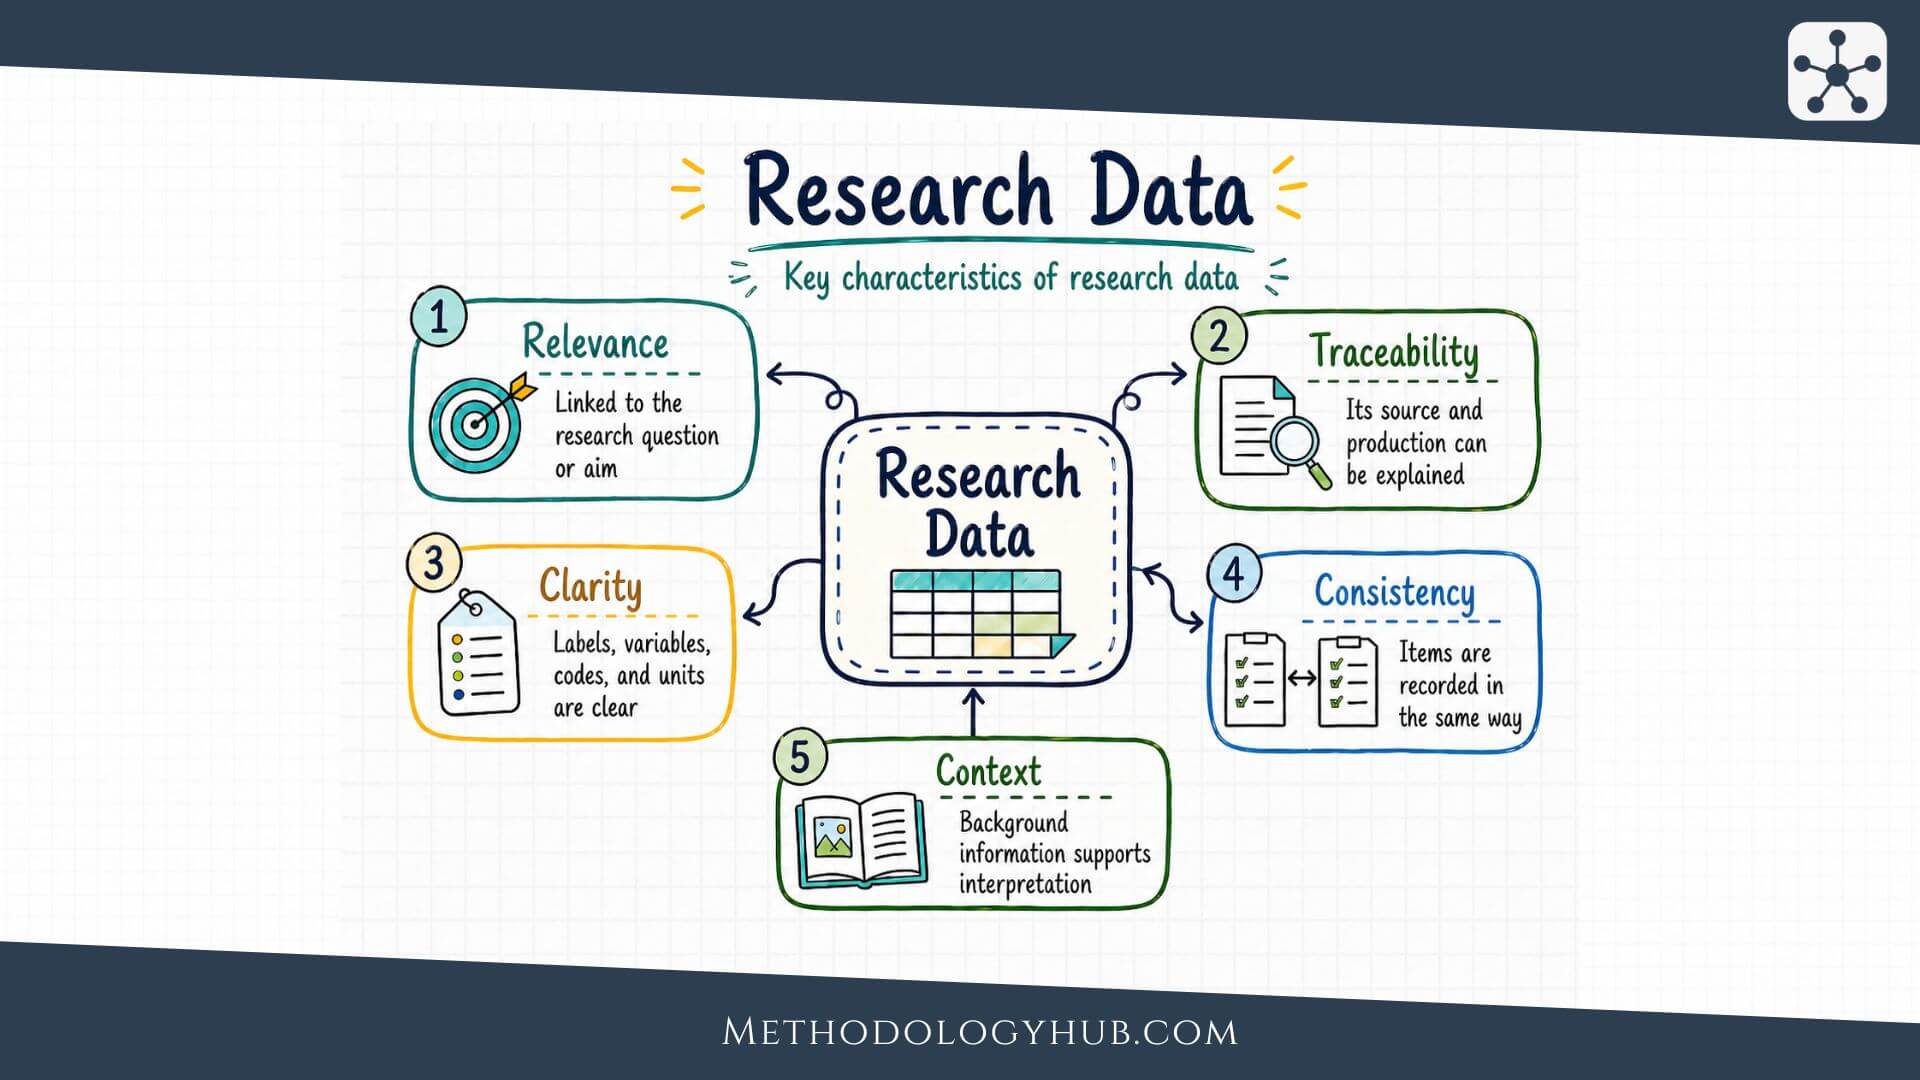
Strong research data usually has the following qualities:
- Relevance: it connects directly to the research question or aim.
- Traceability: the researcher can explain where it came from and how it was produced.
- Clarity: labels, variables, codes, and units are described clearly.
- Consistency: similar items are recorded in similar ways across the dataset.
- Context: the data is accompanied by enough background for interpretation.
These qualities do not make all data perfect. Field observations may be incomplete. Interview accounts may be partial. Historical records may reflect the limits of the archive. Experimental measurements may include noise. Research does not require data to be flawless. It requires the researcher to understand what the data can and cannot show.

Research Data vs Information
Research data and information are closely connected, but they are not the same. Data is usually the recorded material. Information is what becomes understandable after that material has been organised, interpreted, or placed into context.
For example, a column of numbers showing blood pressure readings is data. When those readings are grouped by age, compared before and after treatment, and explained in relation to a clinical question, they begin to provide information. A set of interview transcripts is data. When the researcher identifies recurring themes, contrasts between groups, or changes across time, the transcripts begin to support interpretation.
The distinction is useful because research usually moves through stages. First, material is collected or selected. Then it is organised. Then it is analysed. Then it becomes part of an explanation or argument. Data does not speak fully on its own. It needs method, context, and interpretation.
This is also why the same dataset can support different kinds of information. A survey dataset may be used to describe a population, test a relationship between variables, or compare groups. A collection of letters may be used to study language, migration, family life, or institutional history. Research data is therefore not only material. It is material shaped by a question.
Another useful point is that research data can be raw, processed, or analysed. Raw data is the first recorded version, such as original field notes, unedited recordings, direct instrument output, or initial survey exports. Processed data has been cleaned, transcribed, coded, combined, or formatted so it can be examined more easily. Analysed data has already been interpreted through statistical tests, coding schemes, models, or comparisons. Researchers should be clear about which stage they are discussing, because each stage carries different decisions.
This distinction is especially useful when reading research reports. A table in a published article may show analysed results, while the underlying dataset contains many more variables, cases, and preparation steps. The article presents the answer, but the research data behind it shows the route by which that answer was built.
Categories of Research Data
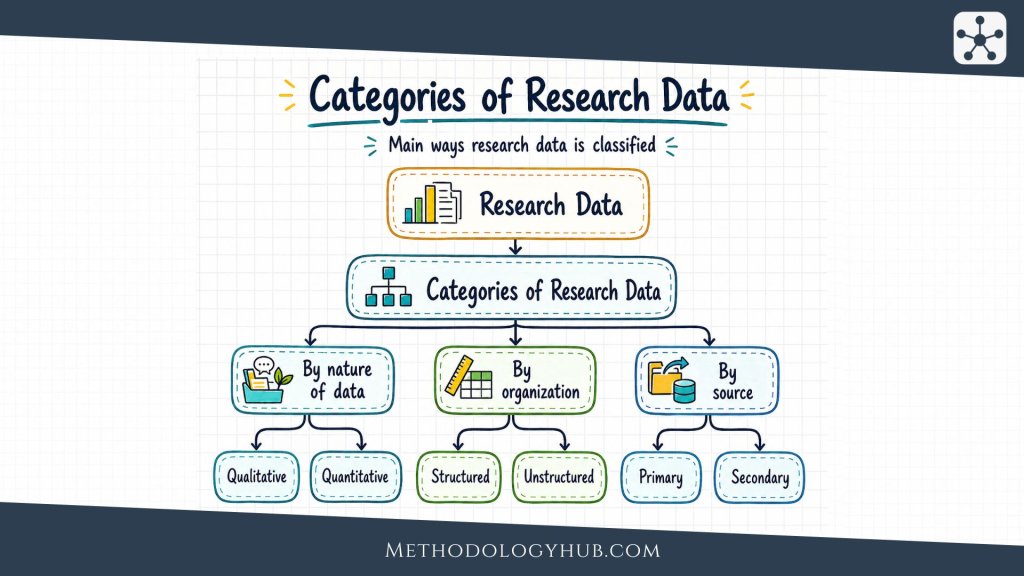
Research data can be grouped in several ways. These categories help researchers decide how to collect, store, analyse, and explain their material. They also help readers understand what kind of evidence a study uses. A dataset may be qualitative and primary, quantitative and secondary, structured and numerical, or unstructured and textual. These labels overlap, so it is better to see them as lenses rather than separate boxes.
Categories are useful because the type of data affects the whole research process. Interview transcripts are handled differently from lab measurements. A historical archive is approached differently from a controlled experiment. A database with fixed fields supports different analysis than a folder of handwritten notes. Once the category is clear, the research design becomes easier to explain.
Qualitative Data
Qualitative data is non-numerical material used to understand meanings, experiences, processes, behaviours, or social contexts. It often appears as words, images, observations, recordings, or documents. Researchers use it when they want to explore how people describe something, how practices unfold, how ideas are expressed, or how context shapes action.
Common examples include interview transcripts, focus group discussions, field notes, diaries, open-ended survey responses, photographs, policy documents, and archival texts. Qualitative data is especially useful when a research question asks how something is experienced, interpreted, organised, or represented.
Qualitative data does not mean vague data. Strong qualitative research can be careful, systematic, and deeply documented. The difference is that the analysis usually works through meaning rather than measurement alone. The researcher may code themes, compare cases, trace narratives, examine language, or interpret patterns in observed behaviour.
Quantitative Data
Quantitative data is numerical material used to measure, compare, count, or model something. It is common in experiments, surveys, clinical studies, demographic research, economics, psychology, epidemiology, and many areas of natural science. It may include scores, counts, percentages, concentrations, temperatures, test results, response times, or sensor readings.
Quantitative data is useful when the research question depends on amount, frequency, scale, distribution, or relationship. A researcher may ask whether one group differs from another, whether two variables are associated, whether a treatment changes an outcome, or whether a trend appears over time.
The strength of quantitative data often depends on measurement quality. If variables are poorly defined, instruments are unreliable, or sampling is weak, the numbers may look convincing while still giving a fragile answer. The value of numerical data comes from how carefully it is produced and interpreted.
Structured Data
Structured data is organised in a fixed and predictable format. It is usually stored in tables, databases, spreadsheets, or forms where each field has a defined meaning. A survey dataset with rows for participants and columns for age, gender, income, and response scores is structured. So is a lab dataset with columns for sample ID, temperature, concentration, and time.
This kind of data is easier to sort, filter, search, calculate, and compare because the structure is already built into the dataset. Statistical software and database systems work especially well with structured data because each value has a clear position and label.
Structured data can still contain errors. A column may use inconsistent units, missing values may be coded differently, or categories may be unclear. The structure helps, but it does not remove the need for checking, cleaning, and documentation.
Unstructured Data
Unstructured data does not fit neatly into fixed rows and columns. It may include interview recordings, handwritten field notes, images, video files, email collections, social media posts, scanned documents, or long-form texts. The material may be rich, but its meaning is not already divided into simple variables.
Working with unstructured data often requires an additional step before analysis. Researchers may transcribe recordings, code texts, annotate images, extract features, or organise files into categories. In qualitative research, this process is often part of the analysis itself. In computational research, it may involve text mining, image analysis, or natural language processing.
Unstructured data can be demanding because it carries context in ways that are not always easy to reduce. A pause in an interview, a gesture in a video, or the layout of an archival document may be part of what the researcher needs to understand.
Primary Data
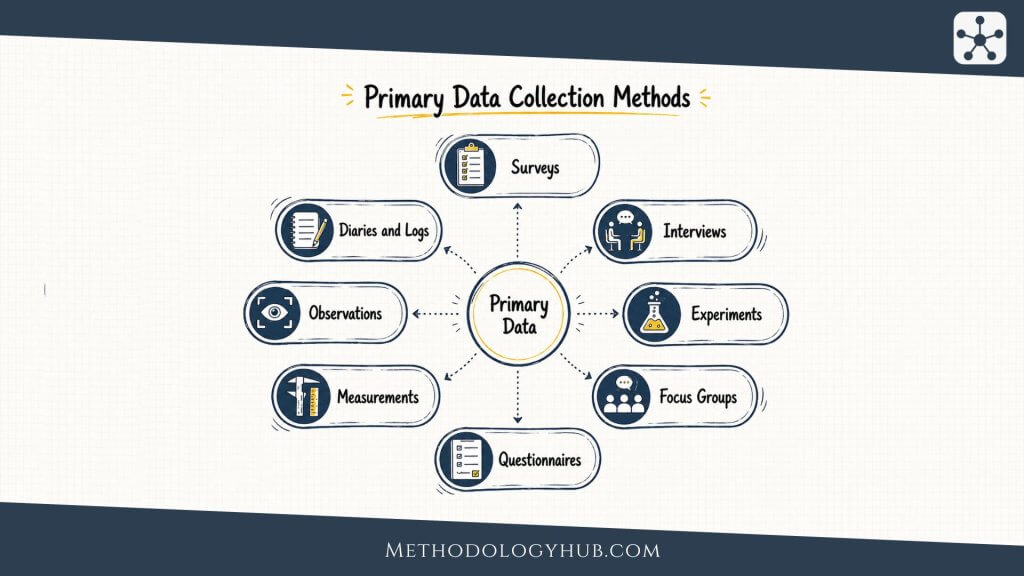
Primary data is data collected directly for the current research project. The researcher designs the collection process, chooses the method, defines the sample or case, and records the material with the research question in mind. Examples include a new survey, a laboratory experiment, original fieldwork, newly conducted interviews, or measurements taken for a specific study.
The advantage of primary data is fit. Because the researcher collects it for the project, the data can be designed around the exact question being asked. The tradeoff is effort. Primary data collection can take time, require access, demand careful planning, and involve practical constraints in the field or laboratory.
Primary data also places responsibility on the researcher. Decisions about sampling methods, wording, instruments, recording, consent, storage, and documentation all shape what the data can later show.
Secondary Data
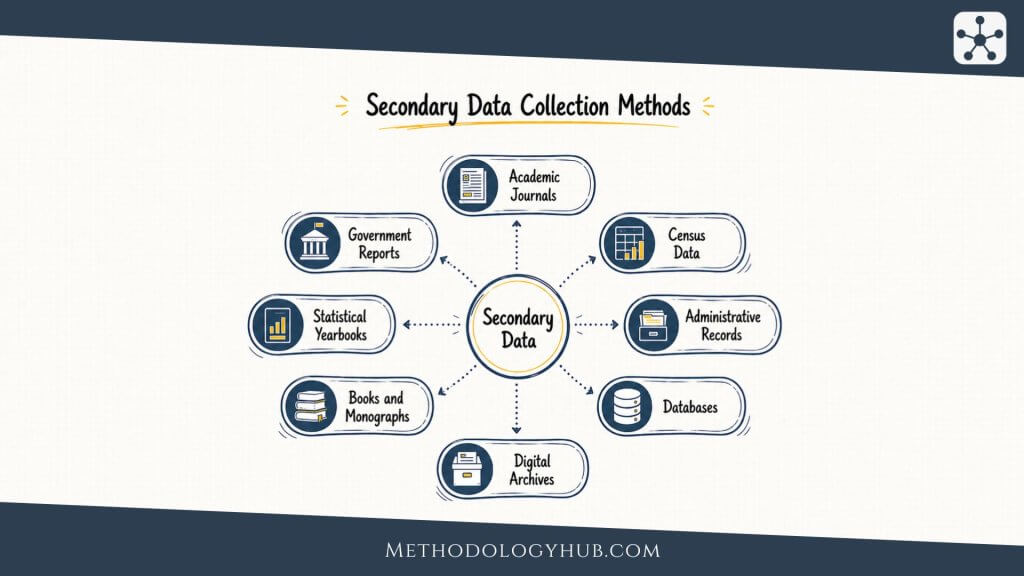
Secondary data is data that already exists before the current project begins. It may come from public datasets, government statistics, institutional records, published archives, prior research, museum collections, digital repositories, or historical documents. The researcher reuses the material to answer a new question or examine a problem from another angle.
Secondary data can save time and allow access to large or long-term material that one researcher could not collect alone. A national census, a clinical registry, or a decades-long environmental dataset may offer research opportunities that would be impossible to create from scratch.
The challenge is fit. Secondary data was usually created for another purpose. The researcher must therefore ask how it was collected, what it includes, what it excludes, and whether its categories match the new research question.
How Data Categories and Types Relate
Data categories often overlap in ordinary research. A set of interview transcripts may be qualitative, unstructured, and primary. A national survey dataset may be quantitative, structured, and secondary. A collection of digitised historical newspapers may begin as unstructured secondary data, then become structured after coding dates, locations, topics, and publication details.
This overlap is not a problem. It is part of how research works. The same material can be described from different angles depending on what the researcher needs to explain. The category tells the reader how the data was produced, what form it takes, and what kind of analysis it can support.
A useful way to think about data categories is to ask three questions:
- What form does the data take? Words, numbers, images, recordings, documents, or measurements.
- How organised is it? Structured in fixed fields or unstructured in open formats.
- Where did it come from? Collected for this project or reused from an existing source.
These questions give the reader a clearer view of the research design before any analysis begins.
Researchers often move between categories during a project. A set of open-ended survey answers may begin as qualitative text, then become partly structured after coding. A set of photographs may begin as visual records, then become categorical data if the researcher counts visible features. A clinical note may begin as unstructured text, then become structured once diagnoses, dates, and outcomes are extracted into a dataset. This does not mean the original material disappears. It means the researcher has created an analytical version of it.
For that reason, data categories should be treated as practical descriptions, not rigid identities. The same source can be prepared in more than one way, depending on the question. What counts is that the researcher explains the transformation clearly enough for readers to follow the path from original material to analysed evidence.
Types of Research Data
The types of research data describe the way values behave inside a dataset. This is especially useful in quantitative and mixed-methods research, but it also helps in qualitative projects that use coding, classification, or counting. A researcher who understands the type of data can choose better methods of analysis and avoid treating one kind of value as if it were another.
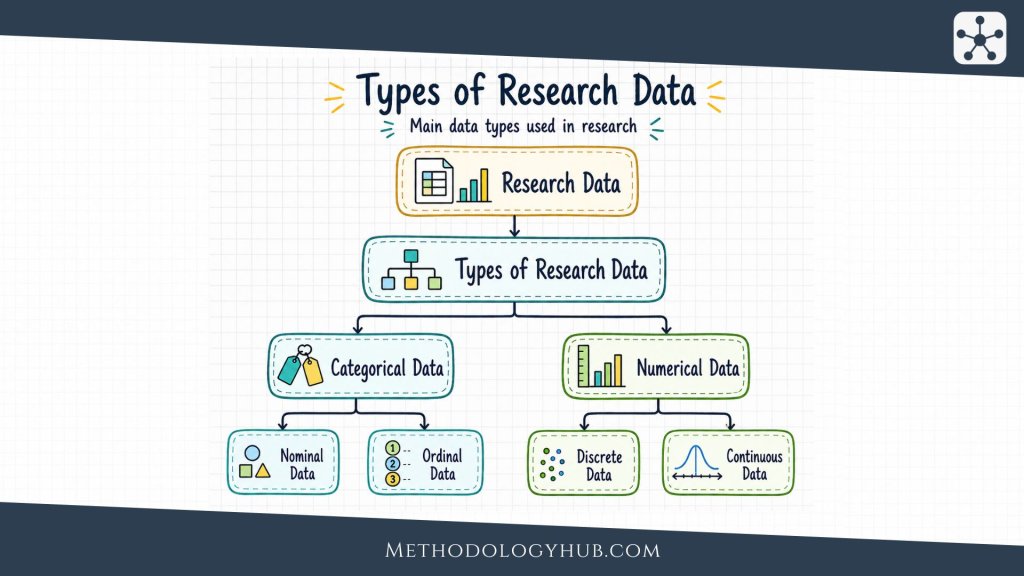
The main distinction is between categorical and numerical data. Categorical data sorts observations into groups. Numerical data records measurable or countable values. Numerical data can then be divided into discrete and continuous data. These distinctions sound technical at first, but they become clear once they are linked to examples.
Categorical Data
Categorical data places observations into groups or labels. The categories may describe identity, type, condition, status, response choice, or classification. Examples include field site, language, diagnosis group, education level, blood type, voting preference, species, treatment group, or response category.
Some categorical data has no natural order. These are nominal categories. For example, eye colour, region, or interview site can be named and compared, but one category is not naturally higher or lower than another. Other categorical data has an order. These are ordinal categories. Satisfaction ratings such as low, medium, and high have a sequence, even if the exact distance between categories is not always equal.
Categorical data is often summarised with counts, percentages, cross-tabulations, or visual displays. It can also be used in statistical models, but the researcher has to preserve its categorical meaning. A category code such as 1, 2, and 3 may look numerical, yet the numbers may only be labels.
Numerical Data
Numerical data records values that can be counted, measured, or calculated. Examples include age, test score, income, number of visits, reaction time, body temperature, rainfall, concentration, distance, or number of citations. Numerical data allows researchers to calculate averages, ranges, rates, correlations, trends, and differences between groups.
The value of numerical data depends on clear definitions. Age may be measured in years, months, or days. Income may be annual, monthly, household, or individual. Temperature may be recorded in Celsius or Fahrenheit. If these details are not documented, analysis can become confused even when the numbers themselves appear neat.
Numerical data can answer questions about scale and variation. It can show whether one group has a higher average than another, whether values cluster tightly or spread widely, or whether a pattern changes over time. Still, numerical data needs interpretation. A mean, percentage, or coefficient does not explain itself fully without the research context.
Discrete Data
Discrete data consists of countable values. It usually answers the question “how many.” Examples include number of children in a household, number of hospital visits, number of errors in a test, number of plant species recorded in a plot, or number of books borrowed from a library.
Discrete values are often whole numbers because they represent counts. You can count three visits or four visits, but not usually 3.6 visits in the same direct sense. Some summaries may produce decimals, such as the average number of visits per person, but the original values are counts.
Discrete data is common in surveys, administrative records, experiments, and observational studies. It can be analysed with methods that respect count-based patterns, especially when the data includes many zeros, uneven distributions, or rare events.
Continuous Data
Continuous data consists of values that can be measured along a scale. It usually answers the question “how much.” Examples include height, weight, time, temperature, pressure, distance, blood glucose level, rainfall, and chemical concentration.
Continuous values can, in principle, fall between whole numbers. A reaction time may be 0.42 seconds. A sample may weigh 12.73 grams. A temperature may be 21.6 degrees. The precision depends on the instrument and method used to measure it.
Continuous data is common in laboratory work, environmental monitoring, medical research, physics, psychology, and engineering. Because it can be measured with fine detail, researchers often examine distributions, averages, variation, and relationships with other variables.
These types affect analysis. It would be strange to calculate an average of unordered categories, just as it would be incomplete to treat a continuous measurement only as a broad label if the detailed values are needed. The type of research data should guide the method, not the other way around.
How to Collect Research Data
Collecting research data means choosing a method for gathering or selecting material that can answer the research question. The process begins before any data is recorded. A researcher has to define the question, decide what kind of evidence is needed, identify the population or source, choose an appropriate method, and create a plan for documenting the process.
Data collection is not only a technical step. It shapes the kind of answer the study can produce. A survey can reach many participants but may limit how much detail each response gives. An interview can produce depth but usually with fewer participants. A lab experiment can control conditions but may simplify the setting. An archive can preserve long-term records but may reflect gaps in what was kept.
Collecting Primary Data
Primary data collection begins with the researcher’s own design. The researcher decides what to collect, from whom or from what, under which conditions, and with which tools. This gives the project a close fit between question and data, but it also requires careful planning.
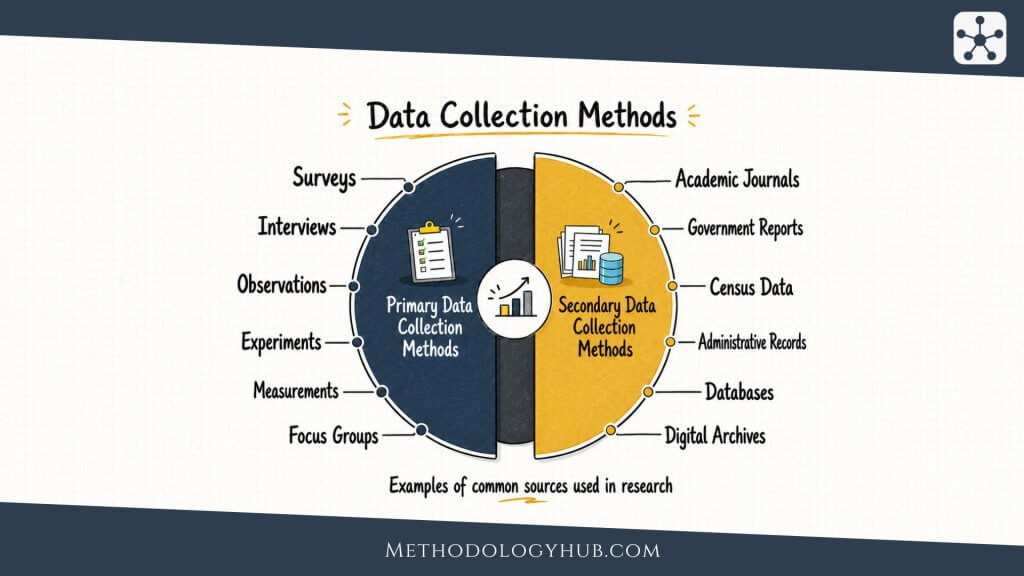
Common primary data collection methods include surveys, interviews, focus groups, observations, experiments, field measurements, laboratory tests, diaries, questionnaires, and direct recordings. Each method creates a different relationship between the researcher and the material.
A survey works well when the researcher needs comparable responses from many people. The wording of questions, response options, sampling plan, and mode of distribution all affect the final dataset. A poorly worded question can produce unclear data, even if the sample is large.
Interviews are useful when the researcher needs depth, explanation, and personal or professional accounts. The data may include transcripts, notes, recordings, and researcher reflections. The strength of interview data often comes from detail and context, but the researcher must document how participants were selected and how the conversation was guided.
Observation is useful when the study focuses on behaviour, interaction, setting, or practice. In a classroom, clinic, laboratory, or public space, what people do may differ from what they later report. Field notes, observation schedules, photographs, and audio or video recordings can all become data, depending on the design.
Experiments and laboratory measurements are common when the researcher needs controlled conditions. The data may include instrument output, sample records, calibration notes, and repeated measurements. In these studies, documentation of procedure is especially important because small changes in conditions can affect results.
Collecting Secondary Data
Secondary data collection begins with locating material that already exists. The researcher may search repositories, archives, public databases, institutional records, government portals, journal supplements, museum collections, or prior research datasets. The work is not simply downloading a file. It involves judging whether the existing material can answer the current question.
A researcher using secondary data should examine the original purpose of the dataset. A government dataset may have been collected for administration rather than academic analysis. A clinical registry may record treatment details but not include all social factors a study needs. An archive may preserve certain voices more than others because of historical collection practices.
Secondary data collection often requires careful screening. The researcher may need to check the source, date range, variables, definitions, sampling method, file format, access conditions, missing values, and documentation. A dataset that looks suitable at first may become less useful once these details are examined.
The advantage is reach. Secondary data can give access to large populations, long time periods, rare cases, or expensive measurements. It can also allow researchers to ask new questions without collecting data from participants again. The limitation is that the dataset may not have been designed for the new research aim.
Good secondary data use therefore depends on transparency. The researcher should explain where the data came from, why it was selected, how it was prepared, and what limitations followed from reusing it.
Research Data Analysis
Research data analysis is the process of organising, examining, interpreting, and explaining data so that it can answer a research question. It is the stage where material becomes argument. The exact method depends on the kind of data, the research design, and the discipline, but the central task is similar: the researcher has to make sense of the evidence without forcing it to say more than it can support.
Analysis often begins with preparation. Data may need to be cleaned, transcribed, checked, anonymised, coded, labelled, merged, or transformed. This preparation can seem ordinary, but it strongly affects the quality of the analysis. A poorly prepared dataset can lead to confused findings even when the method itself is suitable.
Statistical Analysis
Statistical analysis uses numerical methods to describe data, compare groups, test relationships, estimate uncertainty, or model patterns. It is used in many fields, including psychology, medicine, economics, education, biology, environmental science, and public health.
The method depends on the question and the data type. A researcher may calculate averages and standard deviations, compare treatment and control groups, examine correlations, estimate regression models, or test whether an observed pattern is likely to appear by chance under a particular assumption.
Statistical analysis is powerful when it is matched to the data. The researcher must consider scale of measurement, sample size, distribution, missing values, independence of observations, and the assumptions behind each test. A statistical result is not only a number. It is a claim made under conditions that should be explained.
Descriptive Analysis
Descriptive analysis summarises what the data shows before making broader claims. It may include counts, percentages, means, medians, ranges, frequencies, charts, tables, or short summaries of patterns. This kind of analysis is often the first step in understanding a dataset.
In a survey, descriptive analysis might show the age range of participants, the proportion of responses in each category, or the average score on a scale. In a medical dataset, it might describe patient characteristics before treatment outcomes are compared. In qualitative work, descriptive analysis may summarise the main topics appearing across field notes or interviews.
Descriptive analysis is useful because it keeps the researcher close to the data. Before testing, interpreting, or theorising, the researcher needs to know what is actually present. Many errors are caught at this stage, such as impossible values, unexpected gaps, or categories that were not planned.
Inferential Analysis
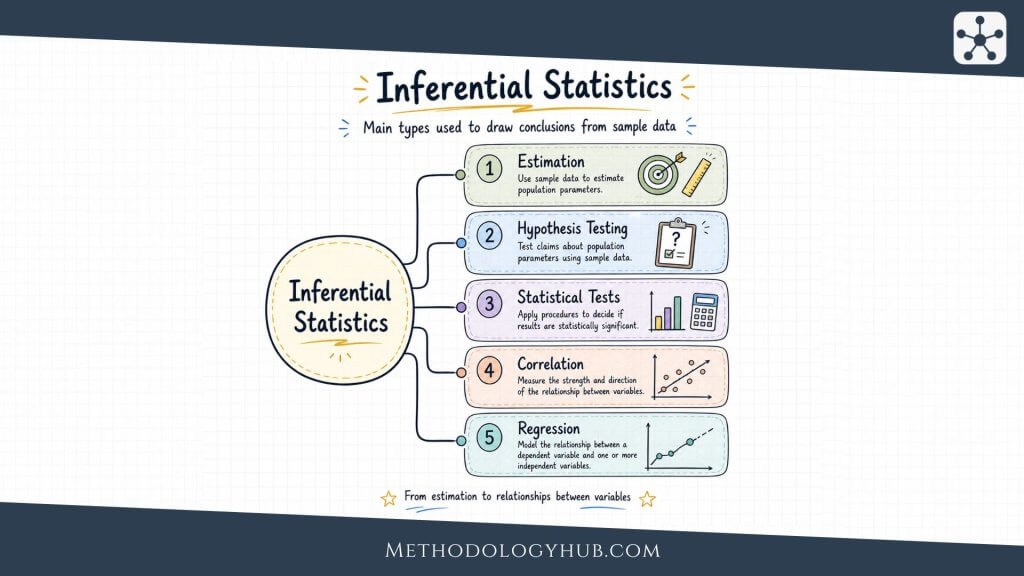
Inferential analysis uses data from a sample to make careful claims about a wider population, process, or relationship. It is common in studies where researchers cannot measure everyone or everything of interest. Instead, they use a sample and estimate what the results may suggest beyond that sample.
Examples include hypothesis tests, confidence intervals, regression models, and other statistical procedures that estimate uncertainty. The aim is not simply to calculate a difference, but to judge whether the difference is strong enough, precise enough, or consistent enough to support a broader interpretation.
Inferential analysis depends heavily on research design. Sampling, measurement, missing data, and model choice all affect what can be concluded. A weak sample cannot be rescued by a complicated test. Strong inference comes from the relationship between design, data, and method.
Qualitative Data Analysis
Qualitative data analysis works with meanings, patterns, practices, accounts, images, or texts. It may involve coding, thematic analysis, discourse analysis, narrative analysis, content analysis, grounded theory, case comparison, or document analysis. The method depends on the research question and the kind of material.
Many qualitative analyses begin with close reading or repeated viewing. The researcher becomes familiar with the material, marks relevant passages, develops codes, groups codes into broader themes, and compares patterns across cases. This process is systematic, but it also requires judgement. The researcher has to decide what counts as a pattern and how that pattern should be explained.
Qualitative analysis often moves between detail and interpretation. A single quotation may illustrate a theme, but it should not carry the whole argument by itself. Strong analysis shows how the example fits a wider pattern in the data and how the interpretation was reached.
Quantitative Data Analysis
Quantitative data analysis works with numbers to describe, compare, and explain measurable features of a research problem. It often begins with preparing variables, checking missing data, examining distributions, and deciding which statistical methods fit the question.
A researcher might use quantitative analysis to compare exam scores between teaching methods, measure changes in air quality, examine the relationship between sleep and stress, or estimate the effect of a treatment on recovery time. The analysis may be simple or complex, but the logic should remain visible to the reader.
Strong quantitative analysis does not end with reporting results. It also explains what the numbers mean in relation to the question. A statistically detectable difference may be small in practical terms. A strong correlation may not show causation. A model may fit the data but still depend on assumptions. The researcher needs to interpret results with care.
In many projects, analysis also includes checking whether the data supports more than one possible interpretation. A pattern in interview data may reflect a shared experience, but it may also reflect the way questions were asked. A difference in numerical data may reflect a real group difference, but it may also be affected by sampling, missing values, or measurement error. Careful analysis keeps these possibilities visible instead of rushing from result to conclusion.
The best analysis is usually not the most complicated one. It is the one that fits the data, answers the question, and remains transparent enough for the reader to follow.
Examples of Research Data
Research data becomes easier to understand when it is seen in concrete settings. The form of the data changes from one field to another, but the underlying principle stays the same. Researchers collect, create, or reuse material because it helps them answer a question. The examples below show how different disciplines use different forms of evidence.
Social Science Data Examples
In the social sciences, research data often concerns people, institutions, behaviour, communication, inequality, policy, culture, or social change. It may be collected through surveys, interviews, observation, administrative records, experiments, digital traces, or public datasets.
A sociologist studying housing insecurity might use interview transcripts from tenants, eviction records, census data, and field notes from community meetings. Each data source would show a different part of the problem. The interviews might reveal how tenants describe uncertainty. Administrative records might show patterns across neighbourhoods. Field notes might capture how local organisations respond.
An education researcher might collect classroom observations, student assessment scores, teacher interviews, and school attendance records. The qualitative data could show how teaching practices unfold in the classroom, while the quantitative data could show patterns in outcomes or attendance.
A political scientist might use voting records, survey responses, party manifestos, media transcripts, or legislative speeches. Some of this data may be structured and numerical. Some may be textual and interpretive. The research design determines how these materials are connected.
Natural Science Data Examples
In the natural sciences, research data often comes from measurement, observation, experiment, modelling, or field collection. It may include instrument readings, sample characteristics, genomic sequences, species counts, satellite images, chemical concentrations, sensor data, geological records, or climate measurements.
An ecologist studying changes in a wetland might collect water quality readings, species observations, soil samples, rainfall records, and satellite imagery. The dataset may combine continuous measurements, categorical species labels, spatial coordinates, and visual material.
A chemist might record reaction times, temperatures, reagent concentrations, spectral readings, yields, and notes from repeated trials. The data is not only the final result. The conditions under which each result was produced are also part of the record.
A climate researcher might use decades of temperature readings, ocean measurements, ice core records, satellite data, and model outputs. Some data may come from direct observation, while other data may be generated through computational processing. Documentation helps readers understand how each layer was produced.
Medical Research Data Examples
In medical research, data often relates to health, treatment, diagnosis, symptoms, biological samples, clinical outcomes, or patient experience. It may include lab results, imaging files, electronic health records, trial data, questionnaires, genomic data, physiological measurements, medication records, and interview transcripts.
A clinical trial may collect baseline characteristics, treatment assignment, symptom scores, adverse events, laboratory values, imaging results, and follow-up outcomes. The structure of the dataset is usually planned before the trial begins so that the results can be compared clearly.
An epidemiological study might use hospital records, public health surveillance data, laboratory confirmations, demographic variables, and location data. The goal may be to understand the distribution of a condition, identify risk factors, or compare outcomes across groups.
A qualitative medical study might use patient interviews, clinician interviews, consultation observations, or diaries. This kind of data can show how people experience illness, treatment, uncertainty, or communication in care settings. It can also explain patterns that numbers alone might not reveal.
These examples also show why research data is rarely just one thing. A single study may combine documents, measurements, interviews, and records. The strongest research designs explain how each source contributes to the answer and where its limits are.
Conclusion
Research data is the recorded material that allows research to move from a question to a supported answer. It may be numerical or textual, structured or unstructured, primary or secondary, simple or complex. What connects all forms of research data is their role in the research process. They provide the evidence that researchers organise, analyse, and interpret.
Understanding research data also means understanding limits. A dataset is shaped by how it was collected, who or what it includes, what it leaves out, how it was labelled, and how it was prepared for analysis. Good research does not treat data as neutral material floating outside the study. It explains where the data came from and why it can support the claims being made.
For students and early researchers, the practical lesson is straightforward. Start with the question, then decide what kind of data can answer it. Describe the data carefully. Choose an analysis method that fits the data type. Keep the connection between evidence and interpretation visible from start to finish.
When those habits are in place, research data becomes more than collected material. It becomes the foundation for careful academic explanation.
FAQs on Research Data
What is research data?
Research data is the material collected, observed, measured, generated, or reused during a study. It can include survey responses, interview transcripts, laboratory readings, field notes, images, audio recordings, numerical measurements, documents, or existing datasets. What makes it research data is not only its format, but its role in answering a research question.
What are the main categories of research data?
Research data is often grouped into categories such as qualitative data, quantitative data, structured data, unstructured data, primary data, and secondary data. These categories describe different qualities of the data. For example, qualitative data usually records meanings, descriptions, or experiences, while quantitative data records values that can be counted or measured.
What is the difference between research data and information?
Research data is the raw or organised material used in a study, while information is what becomes clearer after that material has been processed, interpreted, or placed in context. A list of interview responses is data. A conclusion drawn from patterns in those responses is information. The two are connected, but they are not the same stage of research.
What is structured research data?
Structured research data is arranged in a clear and predictable format, often in rows, columns, fields, or coded categories. Survey datasets, laboratory spreadsheets, demographic tables, and clinical records are common examples. Because the structure is consistent, this kind of data is usually easier to search, compare, filter, and analyse with statistical or computational tools.
What is unstructured research data?
Unstructured research data does not fit neatly into fixed rows and columns. It may include interview recordings, photographs, video material, handwritten notes, field observations, scanned documents, or long-form text. This does not make it weaker. It simply means the researcher may need different methods, such as coding, transcription, content analysis, or thematic analysis, before patterns can be examined.
How is research data collected?
Research data can be collected through surveys, interviews, experiments, observations, field measurements, document review, sensors, laboratory procedures, or by retrieving existing datasets. The right method depends on the research question. A study about attitudes may use interviews or questionnaires, while a study about chemical concentration may rely on laboratory measurement.
How is research data analysed?
Research data is analysed by organising it, checking its quality, and applying methods that fit the type of data and the research question. Quantitative data may be analysed through descriptive statistics, inferential statistics, modelling, or comparison between groups. Qualitative data may be analysed through coding, themes, categories, interpretation, and close reading of meaning in context.
What are examples of research data?
Examples of research data include survey answers in a social science study, soil samples in an environmental study, gene sequences in biology, patient measurements in medical research, temperature readings in climate research, interview transcripts in education research, and archival records in history. The form changes across disciplines, but the data is always connected to a research purpose.
How should research data be stored during a study?
Research data should be stored in a way that protects accuracy, access, and confidentiality where needed. Good storage usually includes clear file names, version control, secure backups, organised folders, documentation files, and suitable access permissions. The exact system depends on the discipline, the sensitivity of the data, and the requirements of the institution or research funder.


