Cross-sectional research is a research design that studies people, groups, records, cases, or other units at one point in time. Instead of following the same units across months or years, the researcher collects data during a defined period and uses those data to describe conditions, compare groups, or examine associations between variables.
This article explains what cross-sectional research is, what it is used for, which designs and methods are common, how it differs from longitudinal research, how to perform it, and how to interpret examples without making stronger claims than the design can support.
What Is Cross-Sectional Research?
Cross-sectional research is a design in which data are collected from a study population at a single point in time or during a short, defined period. The aim is to capture a snapshot of characteristics, behaviours, opinions, exposures, outcomes, or relationships as they exist during that period.
The word snapshot is often used because it gives the right first impression. A cross-sectional study does not show the full story of how something developed. It shows what can be observed at the time of measurement. A researcher may survey students during one semester, review patient records from one clinic month, observe classroom interactions during a selected week, or analyse test scores collected at the end of a school year.
Cross-sectional research definition
Cross-sectional research means studying a defined population or sample at one point in time in order to describe features, estimate prevalence, compare groups, or examine associations between variables. The design may be quantitative, qualitative, or mixed methods, although it is especially common in survey-based and statistical studies.
A simple example is a researcher who wants to know how many first-year university students report sleeping fewer than seven hours per night. The researcher collects survey data from a sample of students during the same month and calculates the proportion who meet that condition. The study describes the situation during that period. It does not show whether sleep patterns improved or worsened before or after the survey.
This design is used across education, health research, psychology, sociology, public policy, environmental studies, and many other fields. It can be small, such as a classroom questionnaire, or large, such as a national health survey. The size does not define the design. The timing does.
The role of time in cross-sectional research
Time is the easiest way to understand the design. In cross-sectional research, each participant, case, record, site, or unit is usually measured once for the purpose of the study. That measurement may include many variables, but those variables are treated as belonging to the same time slice.
This time structure affects interpretation. If a study finds that students with higher study time also have higher exam scores, the result shows an association in the data. It does not automatically show that study time caused the score difference. The study may not reveal whether study habits came before performance, whether stronger students studied differently because of earlier success, or whether another factor affected both.
Population, sample, and variables
A cross-sectional study still needs the same basic planning language as other designs. The population is the wider group the study wants to describe. The sample is the smaller group or set of units actually studied. The variables in research are the features measured, such as age, income, test score, diagnosis, attitude, attendance, reading time, or access to learning resources.
For instance, a school district may define the population as all grade 9 students enrolled in public schools during the spring term. The sample may be students from selected schools who complete a questionnaire. The variables may include reading frequency, library access, home language, grades, and self-reported confidence. A cross-sectional design brings these pieces together at one time point.
The design becomes stronger when these pieces are described plainly. Readers should be able to tell who was eligible, how the sample was reached, what was measured, and when data collection happened. Without that information, the word cross-sectional tells only part of the story.
Objectives of Cross-Sectional Research
The objectives of cross-sectional research usually fit into a few related tasks. A study may describe a population, estimate how common something is, compare groups, or examine whether variables are associated. These objectives often overlap. A survey of teacher workload, for example, may estimate average workload, compare school types, and examine whether workload is associated with stress scores.
The important point is that the objective should match what a one-time design can reasonably answer. A cross-sectional study can be very useful when the question asks what exists, how common it is, or how variables are related at the time of measurement. It is weaker when the question asks how something changes or whether one variable caused another across time.
Describing a population or group
One common objective is description. The researcher wants to know what a group looks like in relation to selected characteristics. This may involve percentages, averages, categories, scales, or themes, depending on the type of research data collected.
An education researcher might describe the proportion of students who have regular access to a quiet study space. A health researcher might describe the percentage of clinic patients who report a particular symptom. A social researcher might describe attitudes toward community services in one district. In each case, the result is tied to the population, sample, measurement period, and sampling method.
Estimating prevalence
Prevalence means how common a condition, behaviour, feature, or status is in a population at a given time. Cross-sectional research is often used for prevalence questions because it measures many units during the same period.
For example, a researcher may estimate the prevalence of smartphone use during homework among secondary school students. Another may estimate the prevalence of high blood pressure among adults attending a health screening programme. These studies do not measure incidence, which refers to new cases over time. They measure how common something is at the time of data collection.
Prevalence question: How common is this condition, behaviour, opinion, or characteristic in the defined population during the study period?
Comparing groups
Cross-sectional research can also compare groups that already exist. A study might compare reading confidence across grade levels, test anxiety across programme types, access to digital resources across regions, or physical activity across age groups.
These comparisons can be descriptive or analytical. A descriptive comparison may simply report that one group has a higher average score than another. An analytical comparison may use statistical methods to examine whether the difference is large enough to be interpreted as more than random sample variation. The comparison still remains cross-sectional when the groups are measured at one time.
Examining associations between variables
Another objective is to examine associations. The researcher may ask whether two or more variables tend to occur together. In a student survey, study time may be associated with exam score. In a public health survey, physical activity may be associated with self-rated health. In a sociology study, housing stability may be associated with school attendance.
This objective often connects cross-sectional research with correlational research. The study can show whether variables move together in the dataset. What it cannot do by timing alone is prove which variable came first. For that reason, language such as associated with, related to, or linked with is usually more careful than caused by.
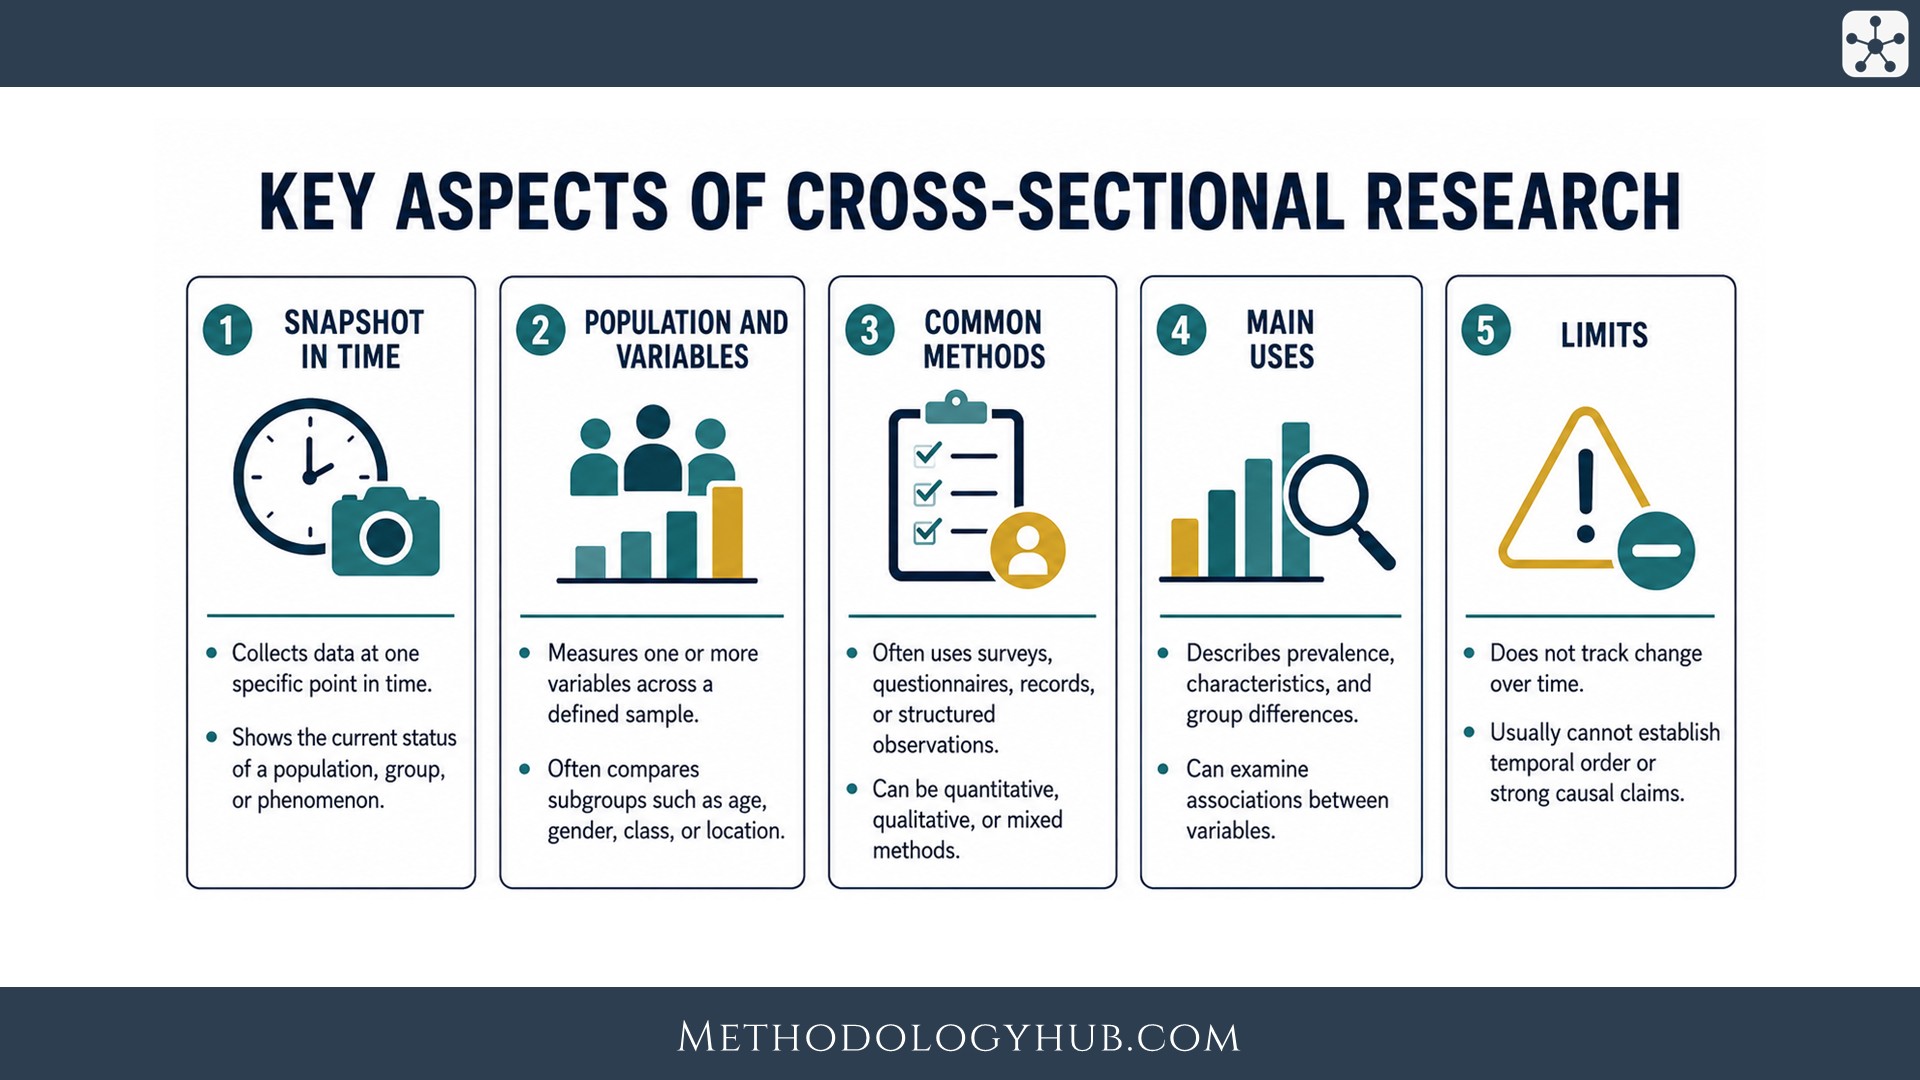
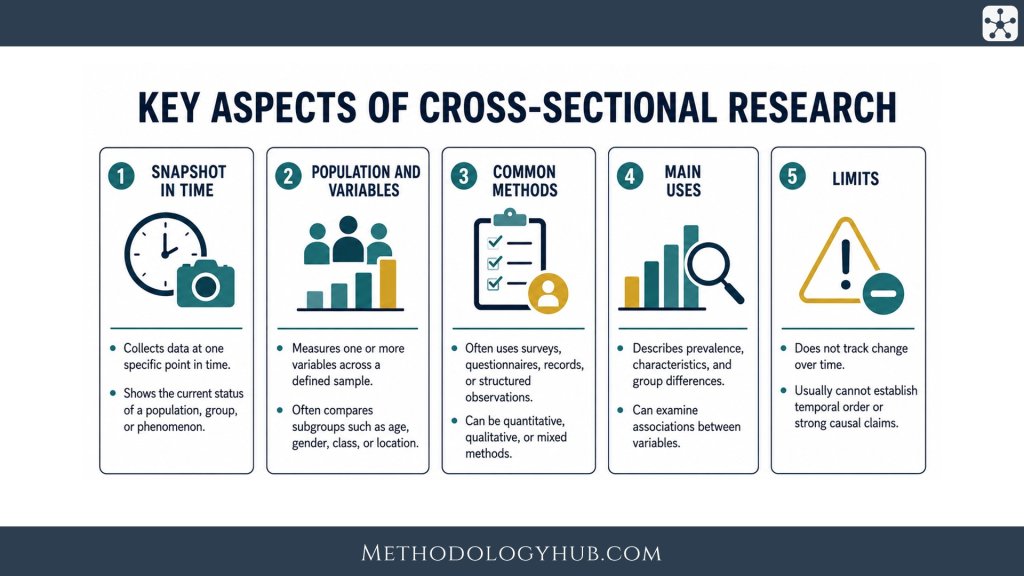
Key Aspects of Cross-Sectional Research
Several aspects shape the quality of cross-sectional research. The design may look simple because data are collected once, but that simplicity can be misleading. The researcher still needs to define the population, choose a sample, decide what counts as the unit of analysis, measure variables consistently, and select an analysis plan that fits the question.
A weak cross-sectional study often fails at one of these planning points. A strong one makes them visible. Readers should not have to guess who was included, how participants were reached, what time period the data represent, or how variables were measured.
Defined time period
The time period should be specific. Saying that data were collected in 2026 may be too broad for some topics. A survey during exam week may produce different results from the same survey during the first month of the semester. A clinic study during winter may differ from one during summer if symptoms or service use vary by season.
For this reason, cross-sectional research often reports the month, semester, school term, clinic period, survey window, or record range. The point is not only administrative. The timing helps readers judge what the findings represent.
Clear unit of analysis
The unit of analysis is the thing being analysed. It may be a person, household, class, school, patient record, article, interview, observation, neighbourhood, or site. Confusion appears when one unit is recruited and another is analysed.
For example, a researcher may recruit schools but analyse students. Another may sample hospitals but analyse patient records. A third may select neighbourhoods and then analyse household survey responses. These designs can be suitable, but the levels should be explained because they affect sampling, analysis, and interpretation.
Sampling plan
Sampling is central to cross-sectional research. A large sample is not automatically a good sample. The sample should fit the population and the claim the study wants to make. A national survey needs a different sampling plan from a small interview study or a class project.
Probability sampling can support stronger population estimates when the population is defined and a useful sampling frame exists. Non-probability sampling may fit exploratory, qualitative, or access-limited studies. In both cases, the researcher should describe how participants or cases entered the study. For a wider explanation of this decision, see sampling methods.
Measurement of variables
Cross-sectional research often measures several variables at the same time. These may include outcomes, exposures, background characteristics, attitudes, scores, behaviours, or contextual features. The quality of the study depends partly on whether those variables are measured clearly and consistently.
If a study asks about stress, the researcher should explain whether stress was measured with a validated scale, a single self-rating item, interview responses, or service records. If a study asks about academic performance, the researcher should state whether performance means grades, test scores, teacher ratings, course completion, or another indicator. The reader needs to know what the variable means in practice.
Analysis and interpretation
Analysis depends on the objective. A descriptive study may use counts, percentages, means, medians, tables, and charts. An analytical study may use group comparisons, correlation, regression, chi-square tests, or other methods from statistical analysis.
The interpretation should stay close to the design. A cross-sectional association can be a useful finding, but it should be read with timing in mind. When variables are measured at the same point, the data may not show which came first. The study can support careful interpretation, but it should not pretend to have followed a process through time unless it actually did.
Cross-Sectional vs Longitudinal Research
Cross-sectional and longitudinal research are often compared because both deal with time. The difference is not only how long a project takes. It is how the design observes the units of analysis.
Cross-sectional research measures units once or within one short period. Longitudinal research measures the same units more than once across time. That difference changes the kinds of questions each design can answer. A cross-sectional study can compare age groups at one time. A longitudinal study can follow the same people as they age.
| Aspect | Cross-sectional research | Longitudinal research |
|---|---|---|
| Timing | Data are collected at one point or during one defined period. | Data are collected from the same units at multiple time points. |
| Main use | Describing current conditions, prevalence, group differences, or associations. | Studying change, development, sequence, duration, or repeated outcomes. |
| Time order | Often hard to establish between measured variables. | Can show whether one measurement occurred before another. |
| Fieldwork | Usually shorter and easier to organise. | Usually longer and more demanding to maintain. |
Example of the difference
Imagine a study of reading confidence among pupils aged 10, 12, and 14. A cross-sectional design could measure different pupils from all three age groups during the same school term. If older pupils report higher confidence, the study shows an age-group difference at that time.
A longitudinal design would follow the same pupils from age 10 to age 14 and measure their confidence repeatedly. That design can show how confidence changes within the same pupils. The two studies may look similar at first because both involve age, but their evidence is different.
When the comparison becomes tricky
Cross-sectional age comparisons can be useful, but they can mix age effects with cohort effects. Pupils aged 14 may differ from pupils aged 10 not only because they are older, but also because they entered school under different conditions, had different teachers, or experienced different events.
Longitudinal research handles change more directly, but it has its own demands. Participants may drop out, repeated measurement may affect responses, and the study may need years to complete. The better design depends on the research question, the available time, and the kind of evidence needed.
Cross-Sectional Research Designs
Cross-sectional research designs can be grouped in several ways. The most common distinction is between descriptive and analytical designs. Some fields also use repeated cross-sectional designs, where different samples are studied at different time points. These designs share a cross-sectional logic, but they answer different questions.
The design label should tell the reader what the study is trying to do. A study that estimates the percentage of students with access to a laptop is not the same as a study testing whether laptop access is associated with assignment completion. Both may use one survey, but their designs and analyses are not identical.
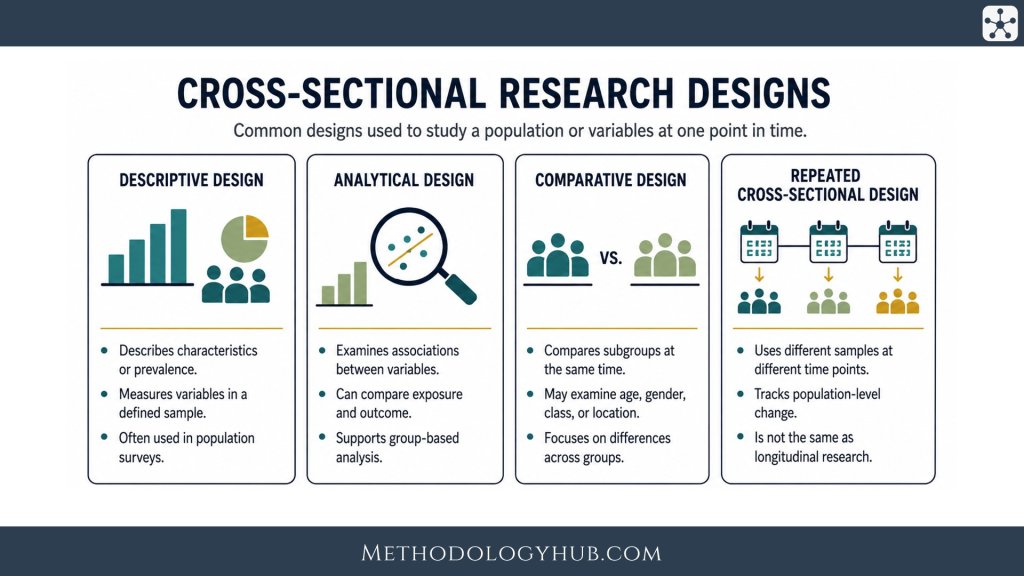
Descriptive cross-sectional design
A descriptive cross-sectional design describes a population or sample at one point in time. It may report percentages, averages, distributions, categories, or profiles. The main aim is not to test a complex explanation but to provide a clear picture of the measured situation.
For example, a descriptive study may report how many students use public libraries, how many patients report sleep problems, or how many teachers use a certain assessment method. These results can be useful for planning, comparison, or later research, but they should be read as descriptions of the measured period and sample.
Analytical cross-sectional design
An analytical cross-sectional design examines relationships between variables. It may compare groups, test associations, estimate adjusted relationships, or build statistical models using data collected at one time.
For example, a researcher may examine whether study environment, sleep duration, and attendance are associated with exam performance. The analysis may include regression to adjust for background variables. Even then, the cross-sectional timing remains important. Adjustment can reduce some alternative explanations, but it does not create a timeline that was not measured.
Repeated cross-sectional design
A repeated cross-sectional design collects data at more than one time point, but not necessarily from the same people. Each wave is a new snapshot. This design is common in large surveys that track population trends over years.
For instance, a national education survey may ask a new sample of students every two years about reading habits. The design can show whether the percentage of students reading daily has changed in the population. It does not show how the reading habits of the same individual students changed unless the same students were followed.
Careful wording: repeated cross-sectional research can show population-level trends, while longitudinal research follows the same units over time.
Cross-sectional correlational design
A cross-sectional correlational design focuses on associations between variables measured at one time. This design is common when researchers want to know whether higher values on one measure tend to appear with higher or lower values on another.
For example, a psychology study may examine whether self-reported sleep quality is associated with attention scores. A sociology study may examine whether neighbourhood belonging is associated with participation in local activities. The design can describe the pattern of association, but it should not be presented as if it has established a causal sequence by itself.
Cross-Sectional Research Methods
Cross-sectional research methods are the practical ways data are collected for a one-time design. Many cross-sectional studies use surveys, but the design is not limited to questionnaires. Researchers may use tests, scales, interviews, observations, administrative records, documents, images, biological measures, or environmental readings.
The method should follow from the question. A study of student opinions may use a questionnaire or interviews. A study of classroom noise levels may use direct measurement. A study of hospital visits may use records. A study of published articles may use document analysis. All can be cross-sectional when the data represent a defined time slice.
Surveys and questionnaires
Survey research is one of the most common methods used in cross-sectional studies. Surveys can collect information from many participants in a relatively short period. They may ask about behaviours, experiences, attitudes, background characteristics, symptoms, or access to resources.
A survey may be delivered online, on paper, by phone, or in person. The mode can affect who responds and how they answer. An online survey about digital access, for example, may miss people with weak internet access unless another route is provided. The method and the sample should therefore be planned together.
Tests, scales, and measurements
Some cross-sectional studies use standardised tests, rating scales, physical measurements, or instrument readings. These methods can provide structured data that are easier to compare across participants or sites.
Examples include reading tests, anxiety scales, blood pressure measurements, soil quality readings, language proficiency scores, or classroom observation checklists. The researcher should explain how the measure was chosen, what it represents, and whether higher or lower values have a clear interpretation.
Records and existing data
Cross-sectional research can also use existing records. A researcher may analyse clinic records from a single month, student attendance data from one school term, library borrowing records from one academic year, or public datasets collected through a national survey.
Existing data can save time, but they were often created for another purpose. The researcher should check whether the records include the variables needed, whether definitions are consistent, whether missing data are serious, and whether the time period fits the study objective.
Interviews and observations
Although cross-sectional research is often associated with quantitative research, qualitative research methods can also be cross-sectional. A researcher may interview participants once about their current experience or observe a setting during a short fieldwork period.
For example, a qualitative cross-sectional study may interview teachers about how they currently use feedback in the classroom. The study can provide depth about current practice, but it does not track how those practices developed unless participants discuss change retrospectively. When qualitative depth is central, links to qualitative research become useful for planning and interpretation.
Cross-Sectional Research Approaches
Cross-sectional research can be approached in different ways depending on the kind of data and the kind of claim the researcher wants to make. The design is often quantitative, but it can also be qualitative or mixed methods. What connects these approaches is the time structure: the study focuses on one defined period rather than following the same units through repeated measurement.
Quantitative cross-sectional research
Quantitative research is the most familiar approach for cross-sectional designs. It uses numerical data to describe, compare, or test associations. The analysis may include percentages, means, confidence intervals, group comparisons, correlations, or regression models.
This approach fits questions such as: What proportion of students report daily reading? Is average stress different across programme years? Are attendance and course performance associated? The strength of the approach depends on measurement quality, sampling, response, and analysis, not only on the number of participants.
Qualitative cross-sectional research
Qualitative cross-sectional research studies experiences, meanings, practices, or views during a defined period. It may use interviews, focus groups, open-ended survey responses, field notes, or documents. The aim is usually depth and interpretation rather than population estimation.
For example, a researcher may interview first-year students once during their first semester to understand how they describe academic adjustment. The study is cross-sectional because each participant is interviewed once within that period. It is qualitative because the analysis focuses on meanings and patterns in the responses.
Mixed methods cross-sectional research
Mixed methods research can also use a cross-sectional design. A researcher may collect survey data and interviews during the same study period, then use the two forms of data to answer related parts of the question.
For instance, a study of student access to learning resources may use a survey to estimate how common different access problems are and interviews to understand how students manage those problems. Both parts can belong to the same cross-sectional time frame, but they contribute different kinds of evidence.
How to Perform Cross-Sectional Research
Performing cross-sectional research well means planning the design before data are collected. The researcher needs to know what question is being answered, who or what will be studied, which variables or topics will be measured, and how the findings will be analysed.
The steps below describe a general process. A small student project may complete them in a simple way. A large national survey may need detailed sampling, fieldwork, weighting, and quality checks. The same basic logic still applies.
Step 1: Define the research question
The research question should be answerable with one-time data. Good cross-sectional questions often ask how common something is, how groups differ, or whether variables are associated during a defined period.
A question such as “What proportion of first-year students report regular use of library study spaces during the spring semester?” fits well. A question such as “How do students’ study habits change from the first to the final year?” needs a longitudinal design if it aims to follow change within the same students.
Step 2: Define the population and sample
The population should be clear enough that readers can tell who is included and who is not. Broad labels such as students, adults, teachers, or patients are usually not enough. A stronger definition includes location, time period, institution, age range, programme, diagnosis, or other eligibility details when relevant.
After that, the researcher chooses a sampling method. A probability sample may be suitable for population estimates. A purposive or convenience sample may fit smaller, exploratory, or qualitative studies, but the conclusions should be written accordingly.
Step 3: Choose variables or topics
The next step is to decide what will be measured. Quantitative studies need variables that can be coded and analysed. Qualitative studies need topics, prompts, or observation categories that fit the question. In both cases, the choices should connect to the research topic and the purpose of the study.
If the study includes a research hypothesis, the variables should allow that hypothesis to be examined. If the study is descriptive, the variables should allow a clear description of the population or sample.
Step 4: Select data collection methods
Data collection methods should be practical and suitable for the participants or records being studied. A questionnaire may work well for a large student sample. Interviews may work better when the study asks for detailed descriptions. Administrative data may fit when the information already exists in reliable records.
The method should also match the time frame. If the study describes current experiences, questions should not drift across unclear periods. Asking “How often did you use the library this semester?” is clearer than asking “Do you use the library?” when the research period is a specific semester.
Step 5: Collect data during the defined period
Data should be collected according to the plan. The researcher should keep track of invitations, responses, exclusions, missing data, and any fieldwork problems. These details help readers understand how the final dataset was formed.
In surveys, this may include the number invited and the number who responded. In record studies, it may include the number of records screened and the number excluded. In interview studies, it may include recruitment routes and the number of participants interviewed.
Step 6: Analyse the data
The analysis should match the study objective. Prevalence questions often use counts and percentages. Comparison questions may use group means, cross-tabulations, or statistical tests. Association questions may use correlation or regression. Qualitative studies may use thematic analysis, content analysis, or another suitable approach.
Before using more complex statistical methods, researchers should check whether the data meet the method’s assumptions. Measurement level, missing data, independence of observations, sample size, and the shape of the data can all affect analysis.
Step 7: Report the design clearly
A clear report states that the study is cross-sectional, describes the population and sample, identifies the data collection period, explains how variables or topics were measured, and reports the analysis plan. This reporting helps readers judge the strength and limits of the findings.
Clear wording also protects interpretation. A strong report does not hide the design behind broad claims. It explains what the study can show from one-time data and where a longitudinal, experimental, or more detailed design would be needed.
Examples of Cross-Sectional Research
Examples make cross-sectional research easier to recognise. The design appears in many fields, but the same logic repeats: data are collected during a defined period, and the study describes, compares, or examines associations within that time slice.
Example from education
A researcher wants to study access to quiet study spaces among secondary school students. During one school term, students complete a questionnaire about home study space, library use, internet access, homework time, and self-rated concentration.
The study can estimate how many students report having a quiet place to study. It can compare access across grade levels or school locations. It can also examine whether quiet study space is associated with homework completion. Because the data are collected during one term, the study cannot show how access changes as students move through school.
Example from health research
A public health team measures blood pressure, physical activity, diet indicators, and background characteristics among adults attending community screening sessions during a two-month period. The study estimates the prevalence of high blood pressure in the screened sample and examines whether physical activity is associated with blood pressure status.
The study can describe the screened group and identify associations worth investigating further. It should not claim that one measured behaviour caused the blood pressure result unless the design and supporting evidence justify that interpretation.
Example from psychology
A psychology study surveys university students once during the middle of a semester. The questionnaire includes sleep quality, perceived stress, attention difficulties, and study routines. The researcher examines whether poorer sleep quality is associated with higher stress and attention problems.
This is cross-sectional because all variables are measured in the same study period. The findings may support careful discussion of relationships between sleep, stress, and attention, but they do not show whether poor sleep came before stress or the reverse.
Example from sociology
A sociology researcher studies community participation in three neighbourhoods. During one month, residents complete a survey about local activities, social support, transport access, and sense of belonging. The researcher compares responses across neighbourhoods and examines which variables are associated with participation.
The study can describe differences between neighbourhoods at that time. It may also suggest which factors are linked with participation. A later study could use interviews, repeated surveys, or a longitudinal design to examine how participation develops.
Example from environmental research
An environmental researcher measures water quality at selected sites along a river during one sampling week. The study records temperature, pH, dissolved oxygen, visible pollution indicators, and nearby land-use features. The analysis describes current water conditions and compares sites.
This is cross-sectional because the measurements represent one period. The study can identify spatial differences along the river. It cannot show seasonal change unless the design is repeated across seasons or extended into a longitudinal monitoring project.
Strengths of Cross-Sectional Research
Cross-sectional research has several practical strengths. It is often easier to organise than longitudinal research because the researcher does not need to follow the same participants over time. It can produce timely data, especially when the question asks about current conditions or prevalence.
It can be efficient
Because data are collected once, cross-sectional studies can often be completed within a shorter period. This can be useful for student projects, school studies, clinic audits, needs assessments, and surveys that need to describe current conditions.
Efficiency should not be confused with carelessness. A good cross-sectional study still needs careful sampling, clear measurement, and suitable analysis. The design saves time mainly by avoiding repeated follow-up, not by skipping planning.
It can study many variables at once
Cross-sectional research can collect data on several variables during the same study period. A survey may include background characteristics, behaviours, attitudes, scores, and outcomes. This makes the design useful for describing patterns and exploring associations.
The advantage is breadth. The caution is interpretation. When many variables are measured at the same time, the researcher should avoid turning every association into a story of cause and effect. Some associations may reflect timing, selection, measurement, or unmeasured background variables.
It can support planning and later research
Cross-sectional studies are often used before more intensive research. A prevalence estimate may show whether a problem is common enough to study further. A group comparison may point to where a later qualitative study should focus. An association may help shape a later research process with stronger timing or experimental control.
For example, a one-time survey may find that students without reliable internet access report more difficulty completing assignments. A later study could follow students over a semester, interview them about barriers, or test an intervention that provides access support.
Limitations of Cross-Sectional Research
The main limitations of cross-sectional research come from its timing. Since data are usually collected at one point, the design is limited in how it handles change, sequence, and causation. These limits do not make the design weak in every situation. They show where interpretation needs care.
It cannot directly measure change within the same units
A cross-sectional study can compare groups of different ages, grades, or experience levels, but it does not follow the same units through change. If older students report different study habits from younger students, the result may reflect age, cohort, curriculum, school conditions, or other differences between groups.
To measure individual change, the researcher usually needs a longitudinal design. A repeated cross-sectional design can show population trends, but it still does not track the same individuals unless the same participants are followed.
It often cannot establish time order
When exposure and outcome are measured at the same time, it can be hard to know which came first. A study may find an association between stress and poor sleep, but the data may not show whether stress affected sleep, sleep affected stress, or both were related to another factor.
Researchers can use theory, previous research, careful measurement, and statistical adjustment to improve interpretation. Still, the time order should not be overstated if it was not observed.
It can be affected by sampling and response bias
Like any design, cross-sectional research can be affected by who enters the study and who responds. A voluntary online survey may overrepresent people who are interested in the topic or comfortable using digital tools. A clinic-based sample may not represent people who never attend the clinic.
This is why sampling and response should be reported. Readers need to know how the final sample was formed before deciding how far the findings can travel beyond the observed cases.
Conclusion
Cross-sectional research is a useful design for studying a population, sample, or set of cases at one point in time. It is often used to describe current conditions, estimate prevalence, compare groups, and examine associations between variables. Its appeal comes from its clear time frame and practical data collection, but its interpretation depends on careful planning.
The design works best when the research question fits a snapshot. If the question asks how common something is, how groups differ, or whether variables are related during a defined period, cross-sectional research may be suitable. If the question asks how people change, which event came first, or whether one variable caused another over time, a longitudinal, experimental, or mixed design may be more appropriate.
A good cross-sectional study therefore does more than collect data once. It defines the population, explains the sample, measures variables clearly, reports the time period, and interprets findings in proportion to the design. When those elements are handled well, cross-sectional research can give readers a clear and useful view of a research problem as it appears during a specific period.
FAQs on Cross-Sectional Research
What is cross-sectional research?
Cross-sectional research is a study design that collects data from a population, sample, or set of cases at one point in time or during one defined period. It is used to describe current conditions, estimate prevalence, compare groups, or examine associations between variables.
What is an example of cross-sectional research?
An example is a survey that measures sleep quality, stress, and study habits among university students during one semester. The study can describe the students during that period and examine associations between the variables.
What are the main objectives of cross-sectional research?
The main objectives are to describe a population or sample, estimate prevalence, compare existing groups, and examine associations between variables. These objectives fit the design because the data are collected during one defined time period.
What is the difference between cross-sectional and longitudinal research?
Cross-sectional research collects data at one point in time, while longitudinal research collects data from the same units at more than one time point. Cross-sectional research is useful for snapshots and group comparisons, while longitudinal research is better for studying change and sequence.
Can cross-sectional research show cause and effect?
Cross-sectional research usually cannot show cause and effect by itself because exposure and outcome are often measured at the same time. It can show associations, but causal interpretation needs stronger support from theory, previous evidence, time order, experimental design, or longitudinal data.


