Data analysis is the systematic examination of information to answer a question. Researchers prepare material, examine patterns and relationships, and interpret what the evidence supports. The material may consist of measurements, interview accounts, documents or several forms of data used together.
Within research methods, analysis connects collected evidence with a finding. This article explains the main approaches to data analysis, the questions an analysis can answer, the steps involved and the tools used to carry them out.
What Is Data Analysis?
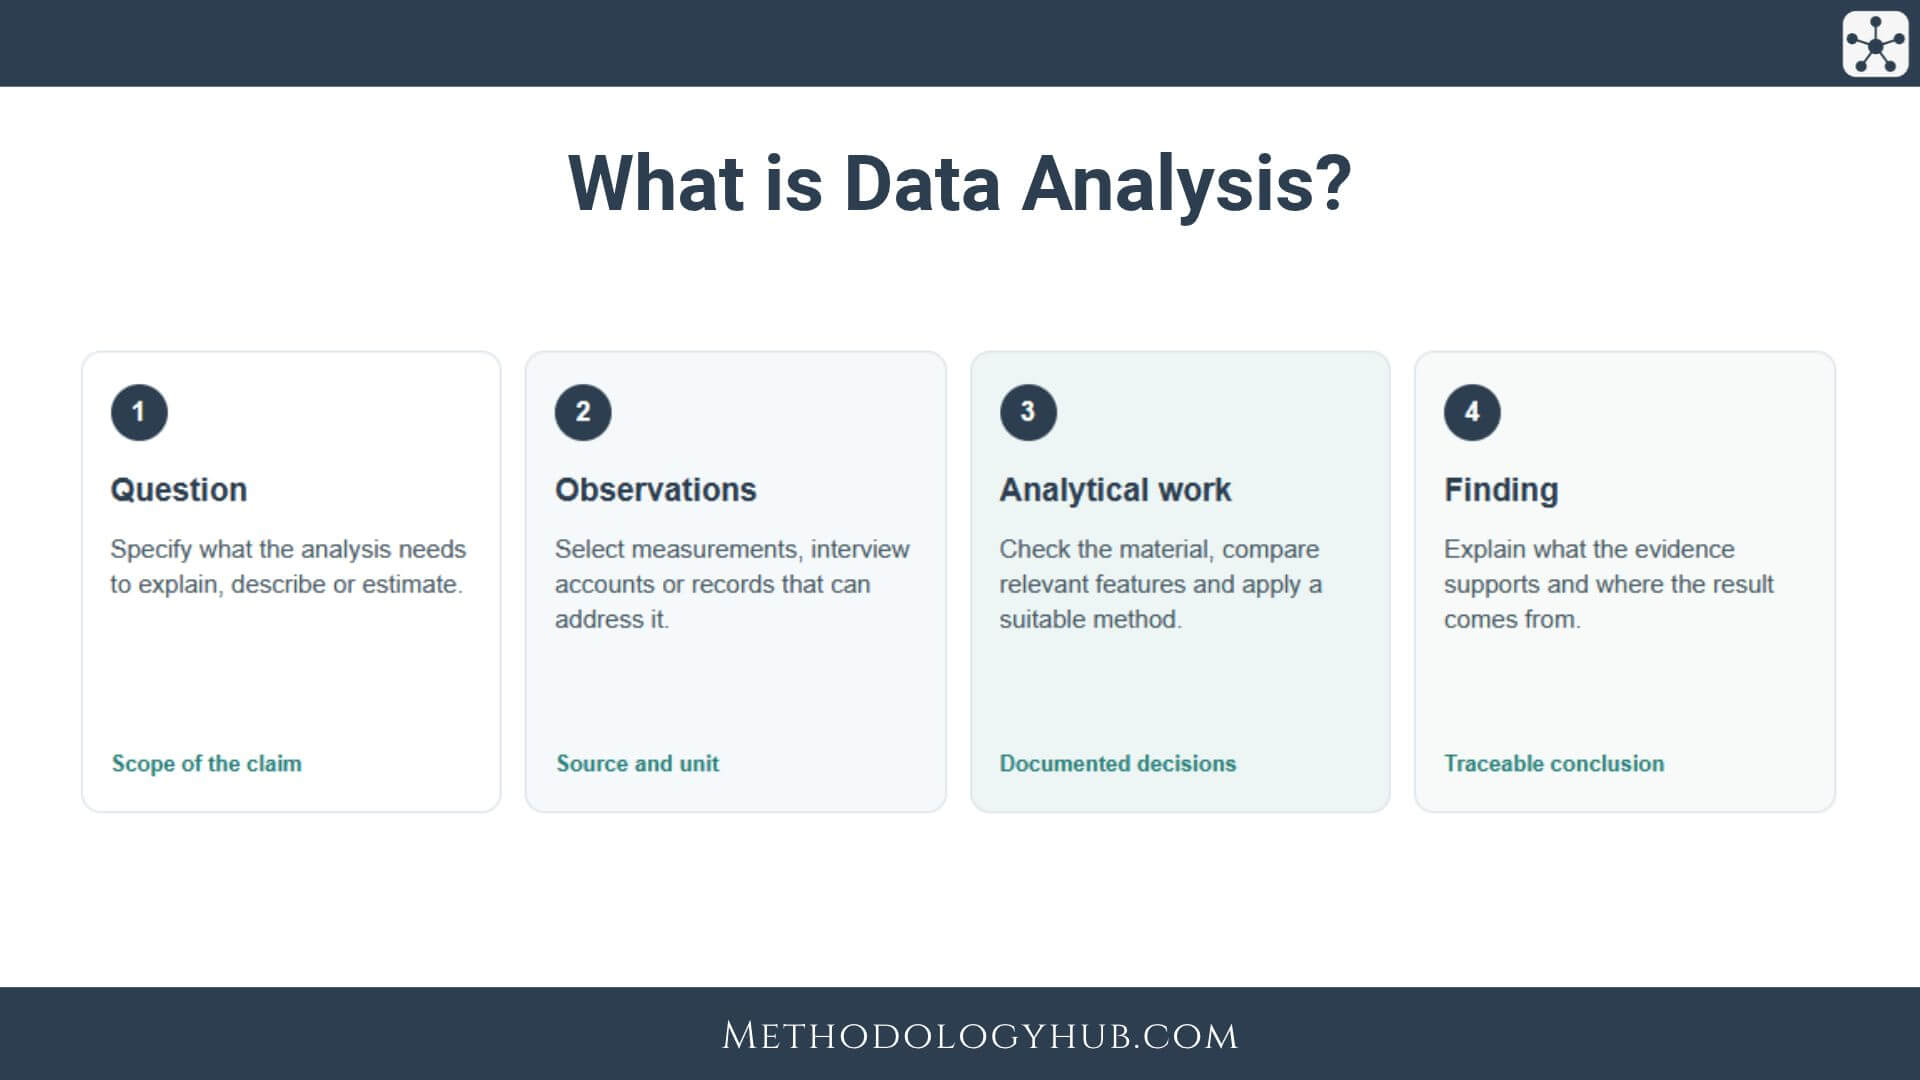
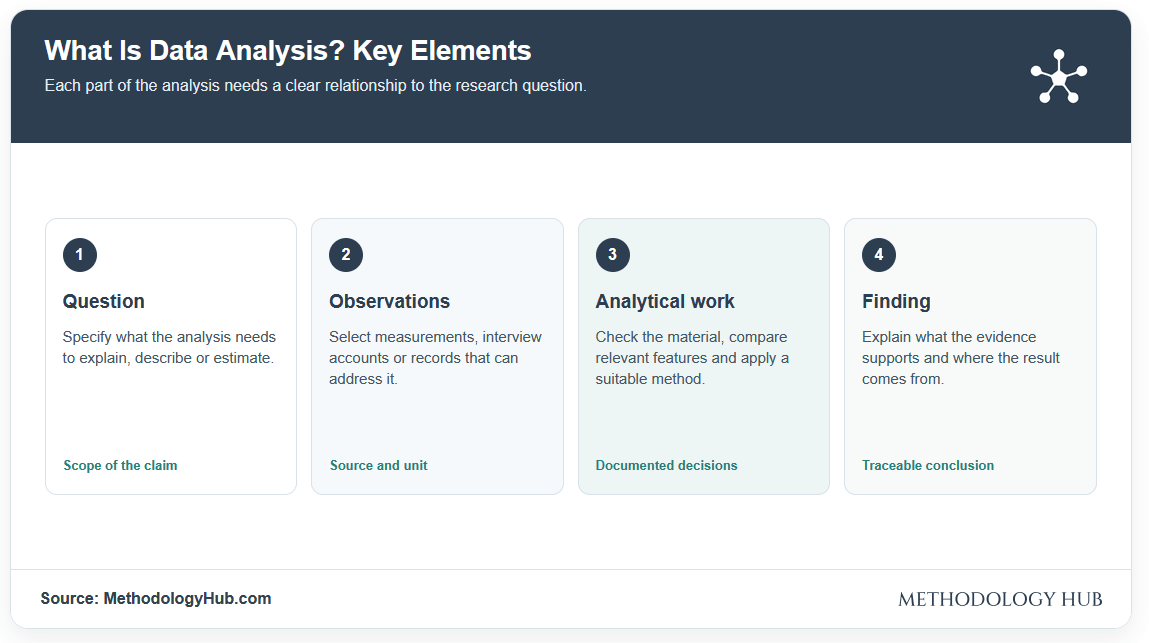
Data analysis turns recorded observations into an answer that can be examined and questioned. It involves deciding what the observations represent, checking their condition, using an appropriate analytical method and explaining the result. A table of figures or a set of highlighted quotations is material for analysis; a finding explains what those observations mean in relation to a question.
Definition and Purpose of Data Analysis
In a research study, the purpose is to produce a defensible account of the phenomenon being studied. The question might concern the distribution of an outcome, the meaning of an experience, a relationship between variables or the combined explanation offered by different sources. Each calls for different evidence. A measured change can establish that a value differed between observations; explaining why requires further analysis and an appropriate design.
Analysis also occurs outside formal research. Schools, hospitals and public agencies examine records to understand services and decide what to investigate next. In each setting, the usefulness of a result depends on whether the data represent the subject of the question and whether the analytical claim fits the evidence.
What Counts as Data?
Data include numerical measurements, categorical responses, written accounts, recordings, images and observational notes. A spreadsheet may contain one row per participant and columns for measured attributes. An interview transcript preserves a connected account whose wording and context may be essential. These forms cannot be prepared or examined in exactly the same way.
Structured data have a regular arrangement, such as survey responses entered under defined variables. Unstructured material, such as free-text responses or video, needs an analytical plan for selecting meaningful segments or features. A dataset may combine forms: a survey can include fixed-choice items and written explanations. Calling both forms “data” does not make their analytical procedures identical.
From Observations to Findings
Analysis begins with a question and a reason for including particular observations. Preparation then makes the material usable without changing what it represents. Researchers explore it, choose procedures suited to the question, and connect the results back to the source and study design. They may return to earlier decisions when they find a coding ambiguity, an unexpected distribution or an unexamined group.
Interpretation is the final intellectual step, even when a software program produces a table or graph. A percentage needs a clear denominator; a quotation needs its setting; a model output needs an account of what was predicted and how it was checked. The reader should be able to follow how the evidence supports the conclusion.
| Material | What analysis can examine | Possible output |
|---|---|---|
| Measurements and counts | Distribution, change and associations | Summary statistics or estimates |
| Interview transcripts | Accounts, meanings and differences | Interpretive categories or explanations |
| Documents and images | Content, representation and context | Classified features and contextual reading |
| Combined sources | Where forms of evidence agree or diverge | An integrated finding |
Approaches to Data Analysis
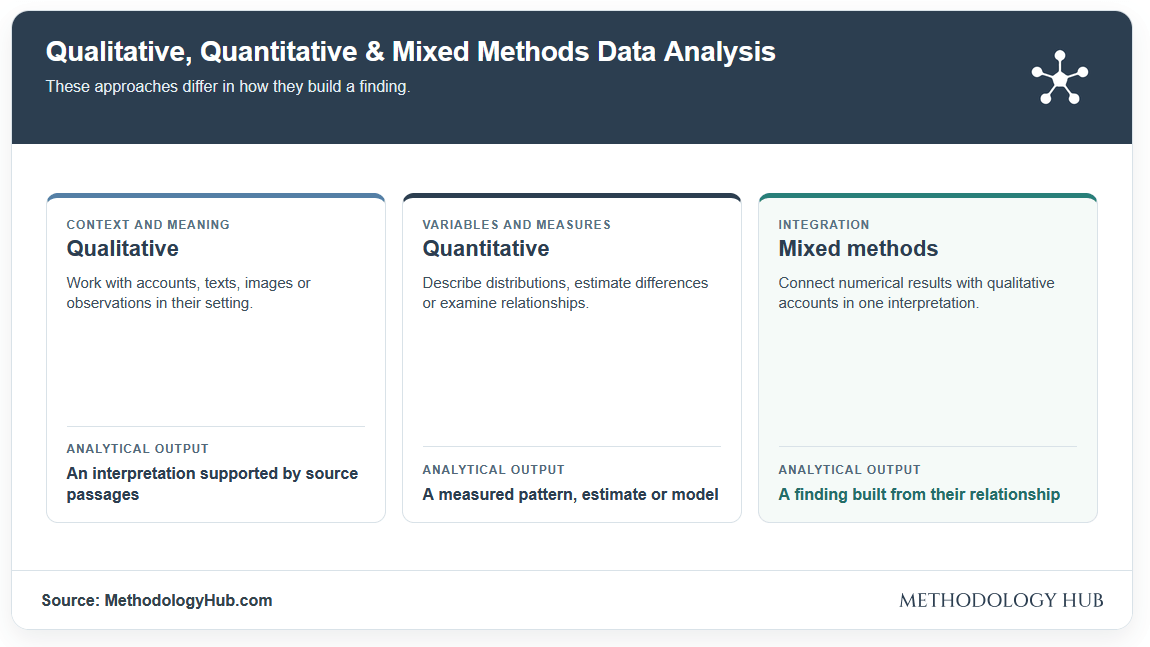
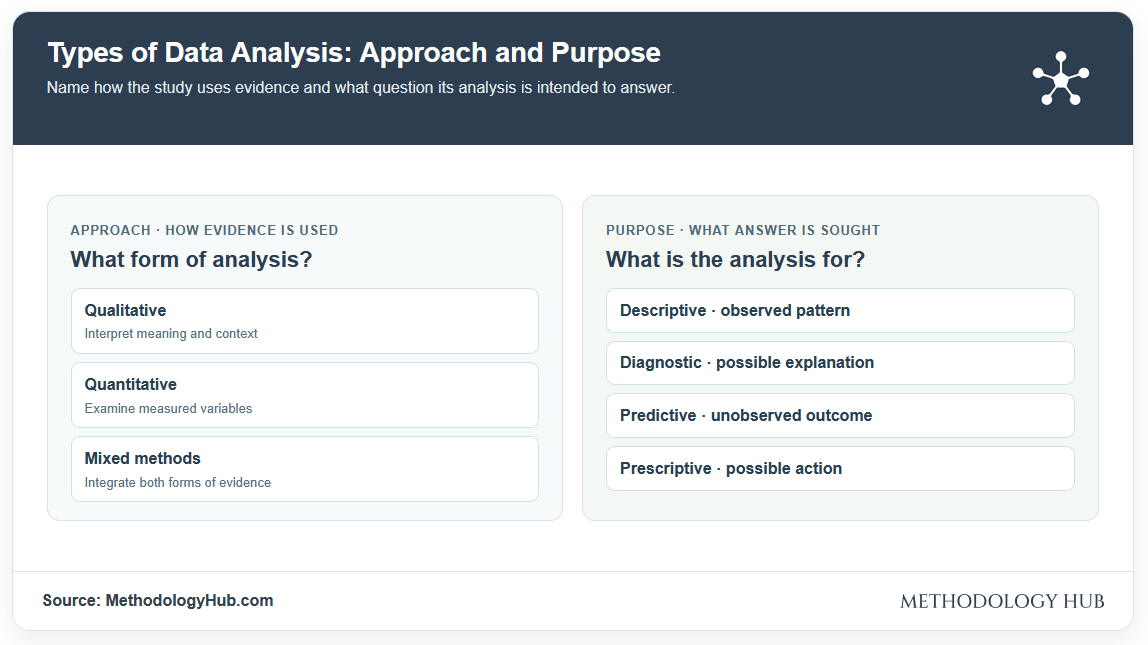
Qualitative, quantitative and mixed methods data analysis describe broad approaches to evidence. Qualitative analysis interprets meaning and context, quantitative analysis examines measured values and relationships, and mixed methods analysis integrates findings from both. The distinction concerns how a question is investigated; a numeric field or a written response alone does not decide the whole study design.
Qualitative Data Analysis
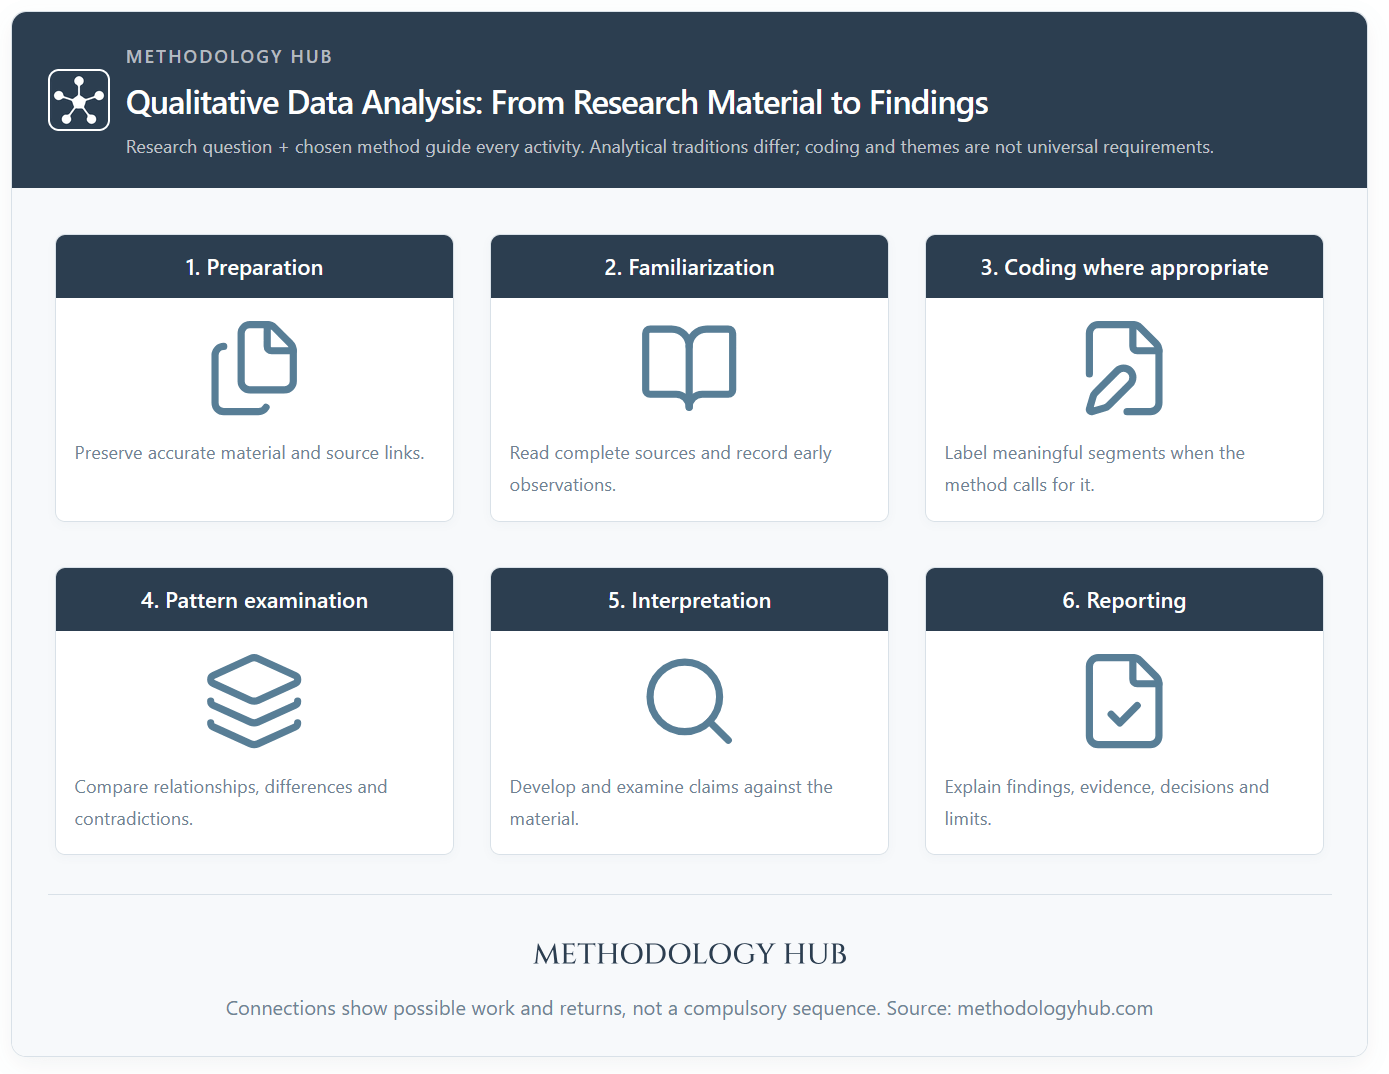
Qualitative data analysis works with accounts, texts, observations, images or recordings to develop supported interpretations. Researchers may read whole sources, annotate relevant passages, compare accounts, develop categories or trace how a story or interaction unfolds. The chosen method determines which of these activities are useful. Coding is common, but not a universal requirement.
A qualitative finding explains a pattern, difference, practice or meaning through evidence from the material. Its strength depends on how well the interpretation fits the source and question, including passages that qualify the account. It is possible to count coded segments, but their frequency does not by itself show the importance or meaning of what participants described.
The wider subject of qualitative analysis includes several methods, each supporting different kinds of interpretation. Here, qualitative data analysis is one approach within the broader subject of data analysis.
Quantitative Data Analysis
Quantitative data analysis examines values assigned to defined variables. The values may be measurements, counts, categories or ratings. Researchers describe distributions, estimate differences, examine relationships and, when the design allows, test hypotheses. A useful analysis states its unit of observation, the population or sample, how variables were measured and how the result was calculated.
Descriptive statistics summarise the observed dataset. Inferential methods use sample information to estimate quantities or test claims about a wider population under stated assumptions. Statistical analysis explains those techniques in more detail. A model can identify an association without establishing that changing one variable would cause another to change; that claim depends on the research design and evidence.
Mixed Methods Data Analysis
Mixed methods data analysis brings qualitative and quantitative findings into a single interpretation. Researchers may analyse each form separately, then compare the results; they may use one result to guide the next phase; or they may bring sources together around a shared set of cases. The defining analytical move is integration. Placing two findings side by side without asking what their relationship shows adds little.
Integration can reveal a gap between a measured pattern and participants’ accounts, explain variation within a group or show that the sources answer different parts of a question. A joint display may place numerical results beside relevant passages and the interpretation of their relationship. The broader mixed methods research design guides when and how the forms of evidence are connected.

“By data type” is a convenient shorthand, but mixed methods is not a third kind of data. It is an approach that combines qualitative and quantitative evidence for a defined purpose. The three approaches can be compared without suggesting that every study fits neatly into one technique or software package.
| Approach | Main analytical work | Typical finding |
|---|---|---|
| Qualitative | Interpret accounts and material in context. | An evidenced explanation of meaning or process. |
| Quantitative | Describe or model defined variables. | A distribution, estimate or relationship. |
| Mixed methods | Connect qualitative and quantitative results. | An interpretation produced by integration. |
Data Analysis by Purpose
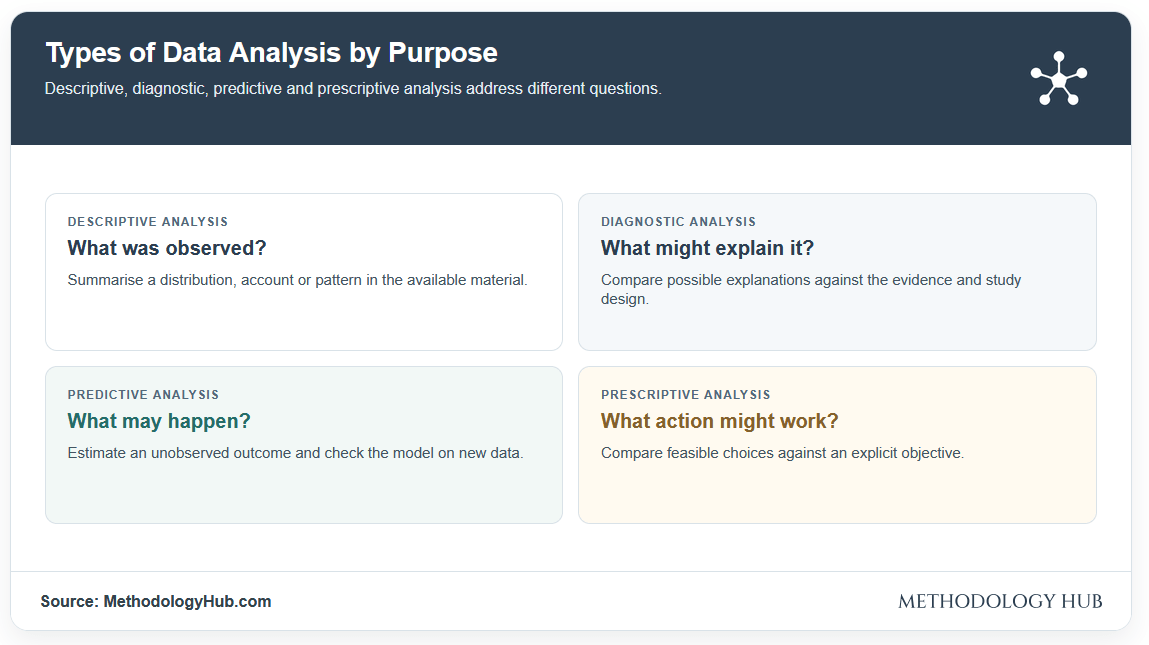
Data analysis can also be grouped by the question it is intended to answer. Descriptive analysis establishes what was observed; diagnostic analysis investigates possible explanations; predictive analysis estimates what may occur; and prescriptive analysis examines possible actions. These purposes can occur within a larger research project and should not be confused with the qualitative, quantitative and mixed methods approaches.
Descriptive Analysis
Descriptive analysis characterises an observed set of data. Counts, proportions and measures of central tendency show how numerical values are distributed, while a qualitative description can organise what participants said or what a set of documents contains. Description is more than decoration for a later model: an overall average can hide differences between groups, and an apparently recurring category can mean different things in different contexts.
The answer depends on the units and time period included. A percentage of respondents is different from a percentage of responses if one person can give several answers. Stating the denominator and selection rule makes a descriptive finding intelligible.
Diagnostic Analysis
Diagnostic analysis investigates why a pattern or event may have occurred. Researchers examine the groups, times and conditions associated with a change, compare possible explanations and seek evidence that could distinguish them. A measured association can narrow the possibilities. Interview material can add an account of how people experienced a change or what conditions shaped their actions.
“Why” is a research question, not a guarantee of a causal answer. A correlation, a retrospective explanation and evidence from a controlled comparison offer different levels of support. A diagnostic account should say which explanation is supported by the design and which alternatives remain plausible.
Predictive Analysis
Predictive analysis uses available information to estimate an outcome that has not yet been observed. Statistical models and machine learning may use earlier observations to make forecasts or assign probabilities. The result is useful only if the target, prediction period and intended population are defined. Assess performance on data separate from the material used to fit the model when the design permits.
A prediction says what may occur under conditions similar to those represented in the evidence. It does not establish why the outcome occurs. Conditions can change, and a model that describes its training dataset closely may still perform poorly on new cases.
Prescriptive Analysis
Prescriptive analysis considers which action may best meet a stated objective. It can combine descriptive findings, predictions, costs and practical constraints to compare alternatives. The objective must be explicit: an action that improves one measured outcome may affect another concern the study has not examined.
A prescription should remain open to assessment after it is applied. Recommendations are stronger when the evidence can distinguish between plausible actions, and when the people making the decision understand the assumptions behind a model or interpretation. Not every study needs to end with a recommendation.
| Purpose | Question | What the finding needs |
|---|---|---|
| Descriptive | What was observed? | Clear units, categories or measurements. |
| Diagnostic | What might explain it? | Comparison and consideration of alternative explanations. |
| Predictive | What may happen next? | A defined target and assessment on new observations. |
| Prescriptive | What action might achieve a goal? | An explicit objective, alternatives and constraints. |
Steps in Data Analysis
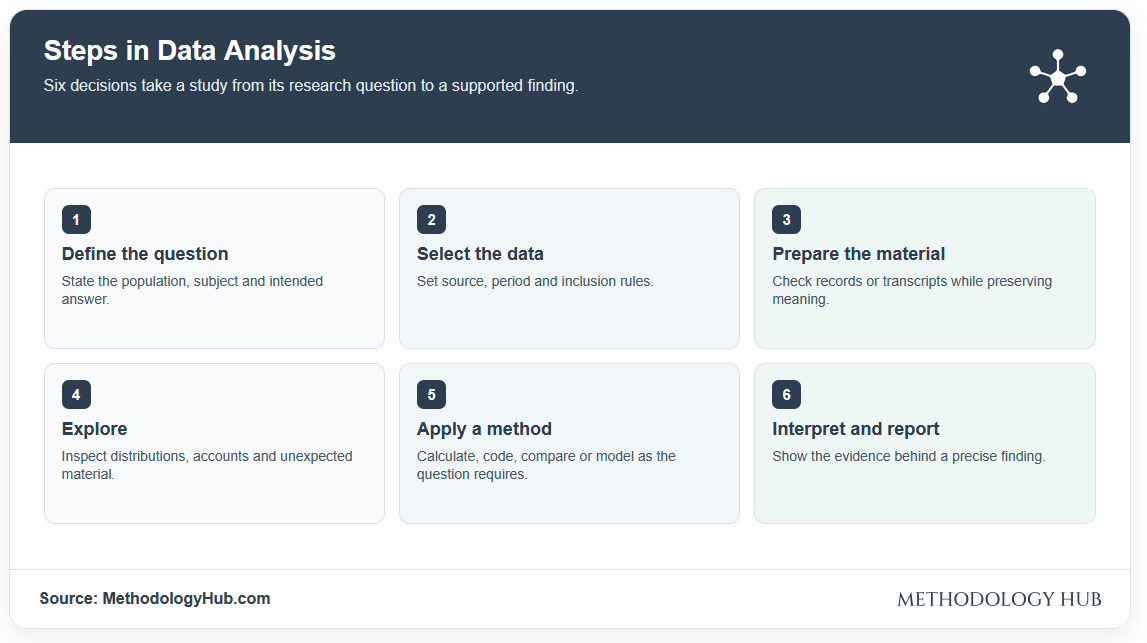
The main steps are to define a question, select or collect relevant data, prepare the material, explore it, apply an analytical method, and interpret and communicate the result. They describe the work that a study needs, not a fixed sequence followed once. A surprising result may send the researcher back to the data source, a variable definition or the original question.
Define the Research Question
A useful question identifies what needs to be known and which observations could answer it. Researchers decide whether they want to describe a distribution, interpret accounts, compare groups, assess a relationship or bring several kinds of evidence together. That decision guides the population, period, unit of analysis and eventual form of the finding.
A broad topic is insufficient as an analytical instruction. The researcher must decide what counts as an observation and what comparison, if any, is needed. A numerical question calls for defined measures. A question about how people understand an experience needs material detailed enough to support interpretation.
Select or Collect Data
Data may be collected through surveys, interviews and observation or obtained from existing records. Select sources because they can answer the question, then document the period, inclusion rules and origin of each record. If several datasets are combined, check whether they describe the same people, places or time intervals and whether the variables mean the same thing across sources.
The selection determines the scope of the result. A convenience sample of volunteers can be informative about those participants, but it does not automatically support estimates for everyone in a larger population. Sampling methods explain how different selection procedures affect what a dataset can represent.
Prepare and Check the Material
For numerical data, inspect missing values, duplicate records, impossible entries, inconsistent categories and units of measurement. Record corrections rather than silently replacing values. An empty cell can mean missing, not applicable or zero; those possibilities have different consequences for an analysis. Combining two files also requires checking that their identifiers refer to the same observation.
Preparation of qualitative material has a different emphasis. Transcripts need accurate speaker labels and links to recordings; documents need provenance and usable versions; images need relevant contextual information. A repeated phrase in an interview may be meaningful and should not be deleted merely because duplicate numerical rows would be removed. The principle is to make the evidence usable while preserving what the method needs to interpret.
Explore the Data
Exploration reveals the shape of the material before a formal finding is settled. For numerical values, inspect distributions, missingness, unusual observations and differences between relevant groups. Tables and plots can show patterns obscured by an average. For qualitative sources, read complete accounts, annotate initial observations and notice disagreement as well as repetition.
At this stage, a researcher may realise that a variable was defined inconsistently or that a transcript excerpt needs more surrounding context. The next task is to examine that issue in the source material, then revise the analytical plan if necessary. Exploration can suggest a question; it does not by itself provide a tested answer to every question it raises.
Apply an Analytical Method
Choose procedures that can produce the intended finding. A quantitative analysis might compare proportions, estimate an association or test a specified hypothesis. A qualitative analysis might organise meaning units into categories, examine a narrative or compare how participants describe a situation. A mixed methods study states where the two sets of results meet and what their connection adds.
Keep the analytical decisions available: variable definitions, category rules, exclusions, revisions, model settings and relevant notes. Quantitative and qualitative research can use the same broad steps while making very different choices within them. The method must serve the question, rather than being selected because a particular tool makes it easy to run.
Interpret and Communicate the Findings
Describe the result in terms the intended reader can assess. State what was measured or interpreted, identify the relevant sources and distinguish a finding from a possible explanation. A comparison can show that groups differ in the observed material; a claim that an intervention caused that difference requires evidence suited to causal inference. If the analysis generated a prediction, report how its performance was assessed.
Present the evidence in a form that fits it: a table for precise values, a chart for a pattern over time, or a short excerpt with enough context to support an interpretation. Labels, units, denominators and category definitions belong with the result. Reporting may reveal a gap in the reasoning and require another pass through the data. A clear account of those choices lets other readers examine the conclusion.
| Step | Decision to make | Record to retain |
|---|---|---|
| Question | What answer is needed? | Question, unit and intended claim |
| Data | Which observations are relevant? | Source and selection rules |
| Preparation | What needs checking or correction? | Cleaning or transcription decisions |
| Exploration | What patterns and anomalies appear? | Initial plots, notes and questions |
| Analysis | Which procedure fits the question? | Codes, calculations and method decisions |
| Reporting | What does the evidence support? | Findings, source links and qualifications |
Data Analysis Example
A single study can use different approaches and analytical purposes without treating them as interchangeable. Consider a fictional university support course. The question is whether attendance at optional sessions is associated with on-time submission of a final project, and how students describe their access to those sessions. The numbers and quotations in this section are invented to illustrate the reasoning.
Research Question and Data
The course has 120 students. The dataset records the number of optional sessions each student attended and whether their final project was submitted on time. The researchers also interview 20 students selected from both high-attendance and low-attendance groups. Attendance records and submission dates are quantitative material; interviews offer accounts of how students used or missed the sessions.
Before analysis, the researchers check that students appear only once, that session records cover the same term and that “on time” refers to the same deadline for everyone. Interview transcripts retain speaker labels and the original questions. These checks make the two sources suitable for comparison without pretending that a transcript and a database row are the same kind of observation.
Quantitative Analysis of Attendance
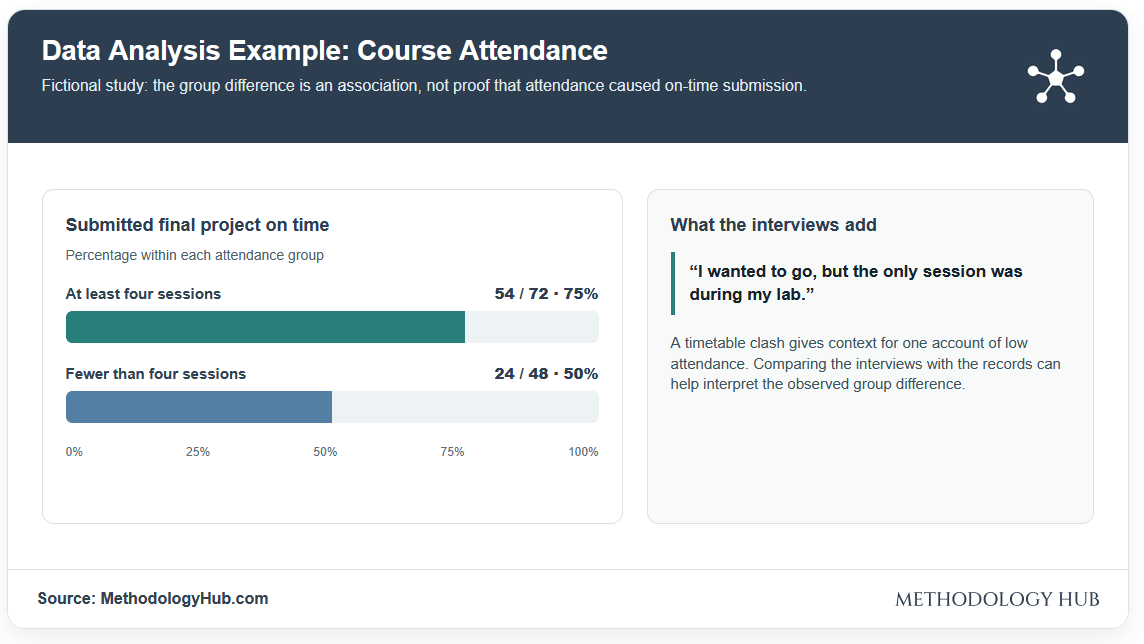
Of the 72 students who attended at least four sessions, 54 submitted on time. Among 48 students who attended fewer than four, 24 submitted on time. The observed proportions are 75% and 50%. This descriptive comparison establishes an association in this course; it does not show that attending sessions caused the difference. Students who chose to attend often may also differ in their available time, prior preparation or other relevant circumstances.
Qualitative Analysis of Student Accounts
The interviews add detail that the attendance count cannot provide. One fictional student says, “I wanted to go, but the only session was during my lab.” Another says, “I went most weeks because someone could tell me which part of my draft needed work.” A researcher might code these passages as a scheduling conflict and specific help with revision, then compare them with other interviews. The first account concerns access; the second describes what a student found useful. Neither quotation represents all 120 students.
Mixed Methods Interpretation
The researchers connect the two results by comparing interview accounts with recorded attendance and submission patterns. If several students with low attendance describe timetable clashes, a simple account that they lacked interest becomes less convincing. If some frequent attendees still submitted late, their accounts may show that access to sessions does not settle every difficulty. The integrated finding would describe both the observed association and the varied circumstances behind participation, rather than treating the interviews as proof of a causal mechanism.
Other Analytical Purposes
A diagnostic inquiry could investigate whether session times, prior preparation or assignment requirements help explain the attendance pattern. A larger dataset from future courses might support a predictive model of submission timing, provided its performance is tested on later students. A prescriptive analysis could compare feasible changes to the timetable and evaluate a small pilot. These are further questions. The fictional dataset alone cannot establish which change would improve submissions.
| Source or group | Observed material | Supported reading |
|---|---|---|
| At least four sessions | 54 of 72 submitted on time (75%). | On-time submission was more common in this group. |
| Fewer than four sessions | 24 of 48 submitted on time (50%). | The groups differed; the count does not explain why. |
| Interview accounts | Twenty selected interviews describe access and use. | Context can qualify interpretations of attendance. |
| Integrated reading | Compare accounts with attendance and timing. | Different forms of evidence address parts of one question. |
Data Analysis Tools
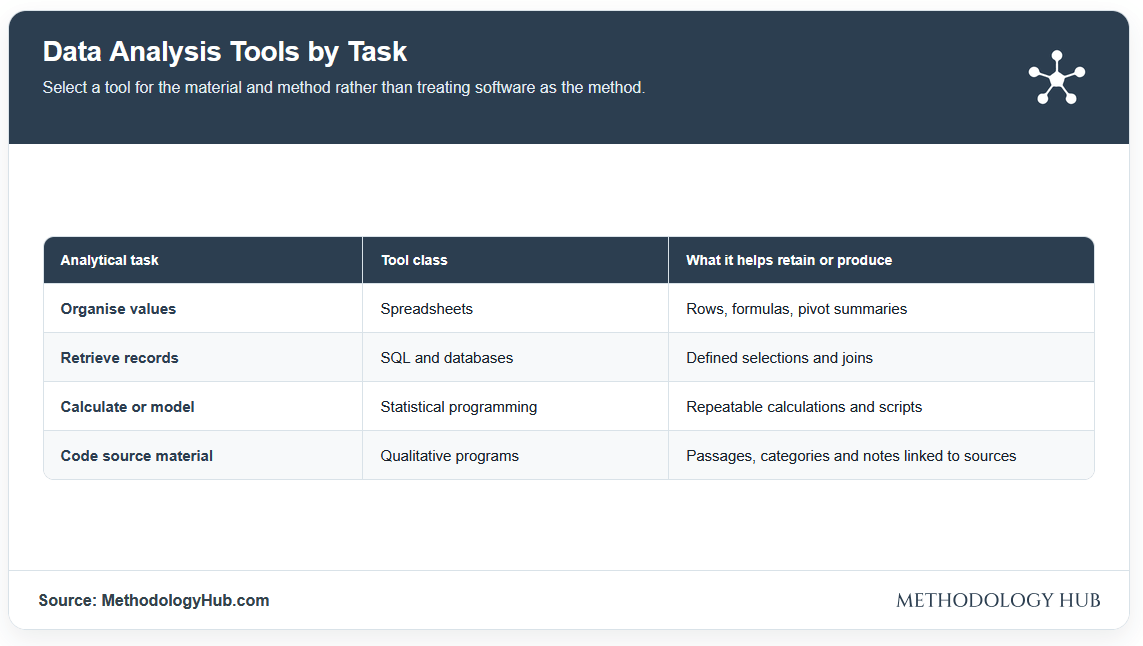
Data analysis tools help researchers store, query, calculate, code and display evidence. The useful choice depends on the form of the data and the planned analysis. A tool can organise a finding, but it cannot decide whether the research question, measurement or interpretation is sound.
Spreadsheets, Databases and Statistical Programs
Spreadsheets support small datasets, calculations and pivot tables. SQL retrieves and combines records in relational databases. R and Python support repeatable statistical analysis, modelling and visualisation; their scripts can also record analytical decisions. For a comparison of programs and their uses, see statistical software.
Qualitative Coding and Visualisation
Qualitative programs can connect passages, codes and notes to their sources. Visualisation tools help present distributions and relationships, with charts labelled by unit and measure. Our qualitative analysis software comparison covers tools for working with interviews, documents and related material.
Conclusion
Data analysis is the work of turning observations into a justified answer. Qualitative, quantitative and mixed methods approaches differ in how they use evidence. Descriptive, diagnostic, predictive and prescriptive analysis describe what the inquiry is trying to learn or decide. A single study can cross those distinctions, provided the question, material and procedures remain clear.
The practical sequence begins with the question and continues through selection, preparation, exploration, analysis and reporting. Results become useful when a reader can see what was observed, how it was examined and why the interpretation follows.