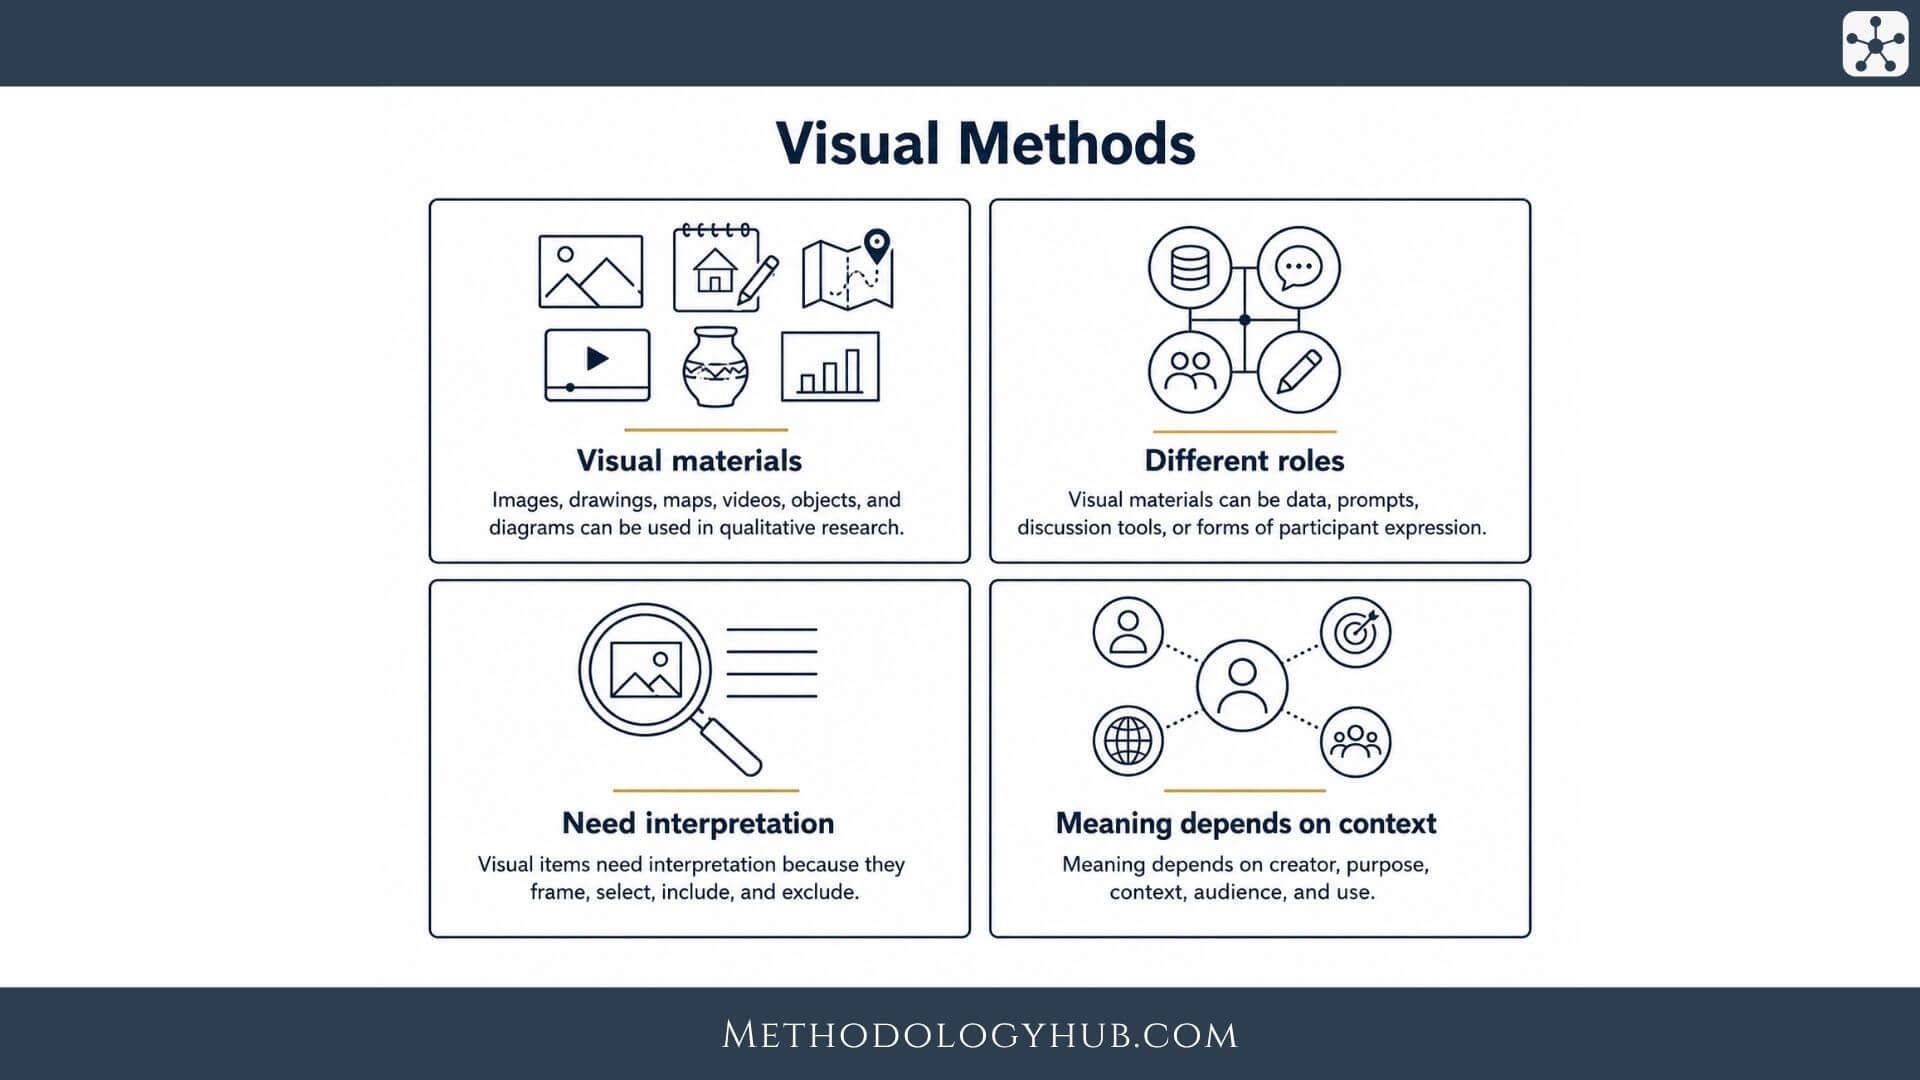
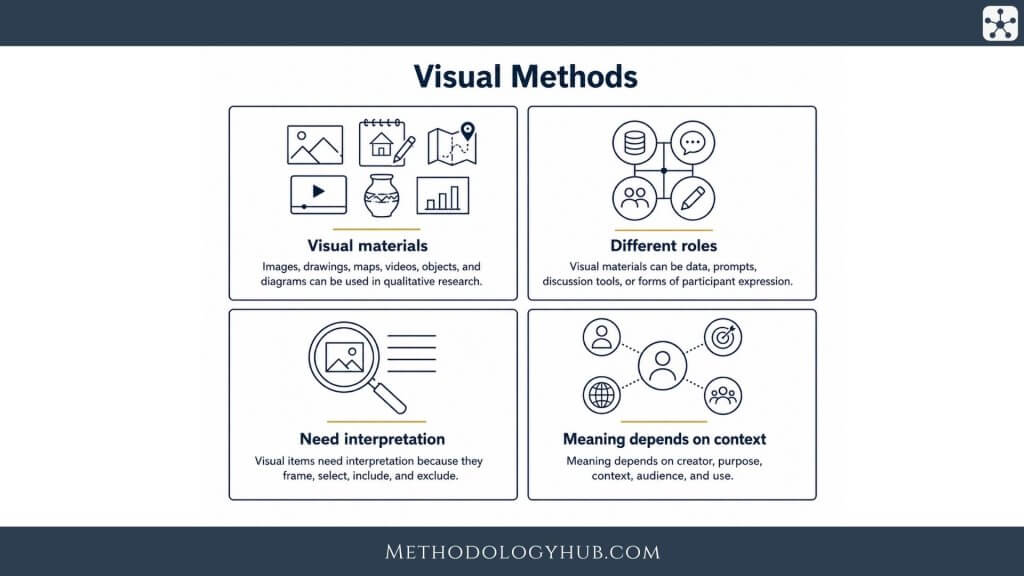
Visual methods in qualitative research use images, drawings, maps, photographs, videos, objects, diagrams, or other visual materials to collect and analyse qualitative data. The visual material may be created by participants, selected by participants, produced by the researcher, or found in existing records.
A photograph can open a conversation that a direct question would not reach. A map can show how someone moves through a neighbourhood. A drawing can help a child, patient, student, worker, or community member express something that is difficult to explain in words alone. Visual methods widen the forms of evidence available to qualitative research.
Among qualitative research methods, visual approaches are often chosen when experience, place, memory, identity, routine, or material environment are important to the study. They can stand alone, but they are frequently paired with interviews, observation, diaries, document analysis, or field notes.
The sections below show how visual methods work, what kinds of visual data can be used, how to design a visual study, how to discuss images with participants, and how to analyse visual material without treating it as simple illustration.
What are Visual Methods
Visual methods use visual material as part of the research design. The image, map, video, object, or drawing is not added only to make a report look more attractive. It becomes a way to ask questions, support recall, represent experience, compare perspectives, or analyse how meaning is made visually.
Sometimes the visual material is the data itself. A researcher may analyse posters, photographs, classroom displays, public signs, or social media images. In other studies, the visual material helps create another form of data. A participant may take photographs and then discuss them in an interview.
Visual methods definition
Visual methods in qualitative research are approaches that use visual materials to collect, produce, discuss, or analyse qualitative data. The visual materials may include photographs, drawings, maps, diagrams, videos, screenshots, objects, collages, timelines, or images from documents and archives.
The method is qualitative when the researcher asks how visual materials communicate meaning, how participants interpret them, how they connect to experience, and how they relate to the research question.
Visual material as data
Visual material can be data in its own right. A set of photographs may show how a community represents a place. A poster may show how a public health message defines risk. A drawing may show how a participant imagines a process, relationship, or space.
Visual data should not be treated as transparent. An image shows something, but it also frames, selects, excludes, arranges, and invites interpretation. The researcher should ask who made it, for whom, when, where, and under what conditions.
Recommendation: ask what the image shows, what it leaves outside the frame, and how the participant or audience makes sense of it.
Visual material as a prompt
Images can also work as prompts. A participant might bring a photograph to an interview and explain why it is important. A researcher might show a map and ask the participant to mark places that feel easy or difficult to access.
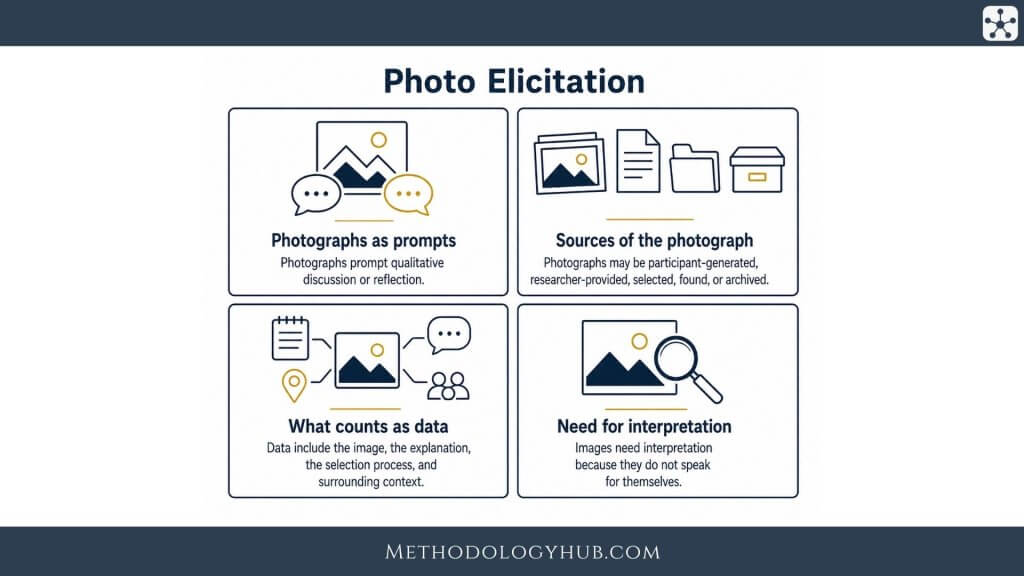
The resulting data include both the visual material and the conversation around it. The participant’s explanation can be as important as the image itself.
Types of Visual Methods
Visual methods vary widely. Some ask participants to create images. Others ask participants to select existing images. Some focus on maps, objects, timelines, screenshots, or video clips. The choice should follow the research question rather than a desire to use visual material for its own sake.
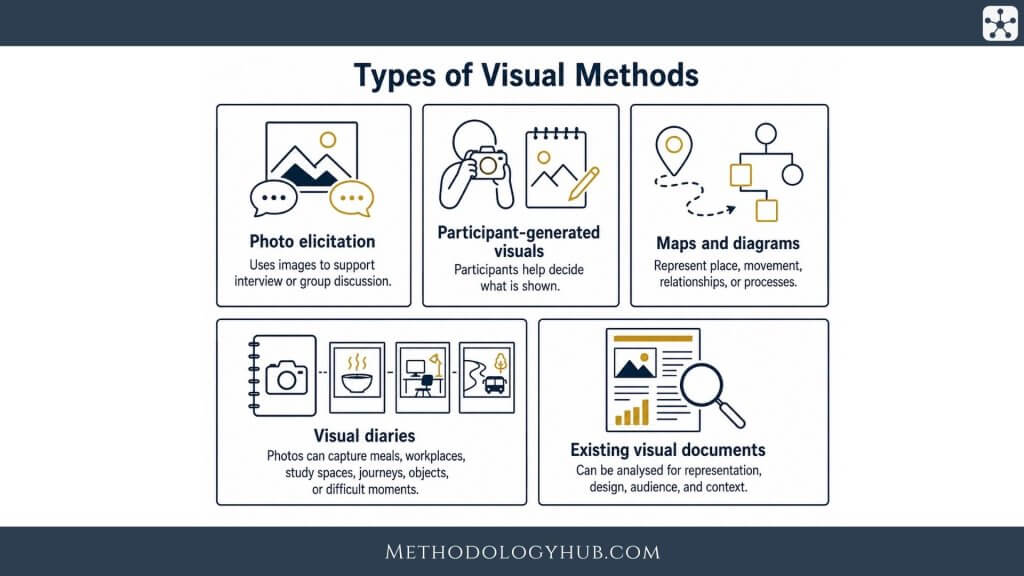
Photo elicitation
Photo elicitation uses photographs to support discussion. The photographs may be taken by the researcher, taken by participants, or selected from existing sources. During an interview or group conversation, participants discuss what the images show and what they mean.
This approach can help participants talk about place, memory, routine, relationships, identity, or change. A photo can make the conversation more concrete because the participant has something specific to point to, question, or reinterpret.
Participant-generated images
Participant-generated images are created by participants for the study. They might take photographs, draw maps, create collages, record short videos, or make diagrams. This approach gives participants some control over what becomes visible in the research.
The researcher should still avoid assuming that a participant-generated image tells its own story. Participants should have a chance to explain why they created or selected the image and what it means to them.
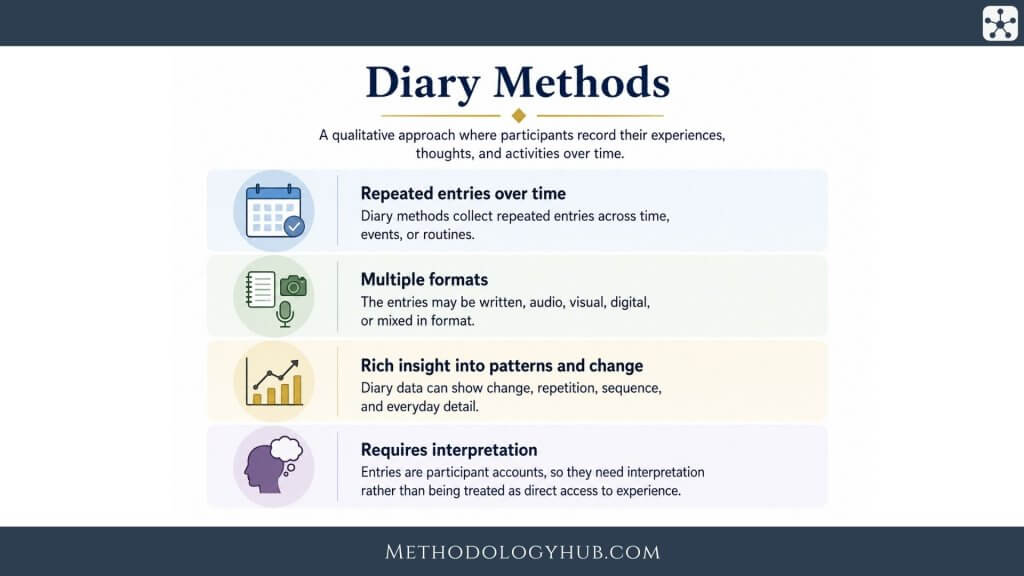
Visual diaries
A visual diary asks participants to create or collect images over time. They may photograph meals, workplaces, study spaces, journeys, objects, or moments of difficulty. Captions or short reflections usually accompany the images.
This design connects visual methods with diary methods in qualitative research. The repeated entries allow the researcher to analyse change, rhythm, and sequence, not just individual images.
Mapping and diagramming
Maps and diagrams can help participants represent places, routes, relationships, decisions, or processes. A participant may draw a map of a neighbourhood, mark places they avoid, or diagram who they ask for help during a difficult task.
These methods are useful when space, movement, access, or relationship patterns are part of the study. The map is not judged for artistic quality. It is used as a research record and discussion tool.
| Visual method | Typical use | Data produced |
|---|---|---|
| Photo elicitation | Discussing images during interviews or groups | Images plus spoken or written explanations |
| Mapping | Studying place, movement, access, or boundaries | Annotated maps, routes, spatial explanations |
| Visual diary | Recording experience across time | Repeated images, captions, reflections, timelines |
Existing visual documents
Researchers can also analyse visual materials that already exist, such as posters, photographs, websites, brochures, forms, public signs, classroom displays, campaign images, or archived media. These materials can be studied through document analysis or archival data analysis.
Existing visuals are useful when the research question concerns representation, public communication, institutional messaging, or change over time.
When Visual Methods Are Useful
Visual methods are useful when the research question cannot be answered well through words alone. They help when the study concerns place, material surroundings, memory, identity, routine, body, emotion, design, communication, or the relationship between people and objects.
They can also support participation. Some participants find it easier to talk around an image than to answer direct questions. Others may use drawings or photographs to express experience when formal language feels limiting.
Studying place and environment
Photographs, maps, and video can help study how people experience places. A participant can photograph spaces that feel welcoming, confusing, unsafe, comfortable, or important. A map can show routes, avoided areas, shortcuts, and boundaries.
This is useful in studies of schools, community spaces, clinics, public transport, neighbourhoods, workplaces, housing, or outdoor environments. Visual material can make spatial experience easier to discuss.
Studying objects and routines
Objects often shape daily life. A tool, phone, notebook, medicine container, kitchen item, badge, form, or piece of furniture can organise action. Visual methods allow participants to show objects that would otherwise be described only briefly.
For example, a study of home study routines might ask participants to photograph their study spaces at different times of day. The images can show lighting, noise control, shared space, materials, interruptions, and small adaptations.
Recommendation: choose a visual method when seeing, showing, placing, arranging, or comparing is part of the data.
Studying memory and change
Images can support memory. A participant may remember a past event differently when looking at an old photograph, a map, or a screenshot. Visual prompts can help bring detail into a conversation without forcing the participant to rely only on abstract recall.
Visual material can also show change. Repeated photographs of a workspace, classroom wall, garden, or project site can document how a setting changes across weeks or months.
When visual methods may not fit
Visual methods are not always appropriate. They may create privacy risks, place extra burden on participants, or distract from a research question that does not need visual data. Some participants may dislike taking photographs or feel uncomfortable drawing.
A method should fit the participant group as well as the topic. If visual production feels difficult or intrusive, a written diary, interview, questionnaire, or observation may be more suitable.
Designing a Visual Methods Study
A visual methods study needs clear decisions about who creates or selects the visual material, what participants are asked to do, how images will be stored, and how the visual data will be analysed. The creative part of the method should not hide the need for a careful design.
Before collecting any images, the researcher should decide whether the study needs participant-generated visuals, researcher-generated visuals, existing visual documents, or a combination. Each option creates a different relationship between participant, researcher, and data.
Start with the research question
The research question should guide the choice of visual task. If the study asks how people use space, mapping or photography may fit. If it asks how people understand a process, a diagram or timeline may be better. If it asks how an organisation presents itself, existing posters or webpages may be the right materials.
Visual tasks should not be added only because they seem engaging. Every image, map, or drawing should have a clear role in the analysis.
Write clear visual tasks
Participants need to know what to create, when to create it, what to avoid, and how much explanation to add. A task such as “take photos of your life” is too broad for most studies. A clearer task might be, “Take up to five photographs of places that affect how you study during a normal week. Add one sentence explaining each photograph.”
Instructions should be simple, practical, and neutral. The task should leave room for participants to decide what is relevant without leaving them unsure what to do.
| Design decision | Question to answer |
|---|---|
| Visual source | Will images be made by participants, made by the researcher, or selected from existing materials? |
| Task boundary | How many images, maps, or drawings should participants create or select? |
| Explanation | Will participants add captions, diary notes, interview explanations, or group discussion? |
Plan consent and privacy before collection
Visual data can identify people, homes, workplaces, schools, street locations, documents, screens, and private routines. Participants should receive clear guidance about what not to photograph, how to avoid capturing other people, and what will happen to the images.
Consent is especially important when images include people other than the participant. The researcher should not assume that a participant’s willingness to submit a photo covers everyone shown in it.
Pilot the visual task
A small pilot can reveal practical problems. Participants may misunderstand the task, submit too many images, avoid captions, photograph identifiable people, or find the activity too time-consuming. A pilot lets the researcher revise instructions before the main study begins.
Piloting can also show whether the visual material actually helps answer the research question. If the images are interesting but analytically unclear, the task may need to be narrowed.
Using Images in Interviews and Groups
Images can change the flow of an interview or group discussion. Instead of moving only through researcher questions, participants can point to details, compare images, tell stories, challenge assumptions, or explain why an image does not show what the researcher might expect.
When images are used in conversation, the researcher should treat the image and the talk together. The image may prompt memory, but the participant’s explanation gives meaning to what is shown.
Photo elicitation interviews
In a photo elicitation interview, the participant and researcher discuss images as part of the interview. The photographs might be taken before the interview or selected during the session. The interviewer asks about what the image shows, why it was chosen, and how it connects to the research topic.
Useful questions include: “Can you tell me about this image?”, “What made you choose it?”, “What is outside the frame?”, and “Would someone else understand this image differently?” These questions invite explanation without forcing one interpretation.
Group discussion with visual prompts
Visual prompts can also be used in group settings. Participants may discuss a set of images, arrange cards, annotate a map, or compare photographs. Group discussion can show agreement, disagreement, shared meanings, and different interpretations of the same visual material.
In this format, the researcher should watch how the group uses the image. Who speaks first? Which images create debate? Which details are ignored? Visual prompts can reveal interaction as well as content.
Recommendation: do not ask only what is in the image. Ask why it was selected, what it leaves out, and how the participant wants it to be read.
Researcher-selected images
Sometimes the researcher brings images to the interview. This can be useful when the study needs responses to the same visual material. For example, several participants might discuss the same public information poster, map, or website screenshot.
The researcher should be careful not to make the image too leading. Participants should be allowed to disagree with the researcher’s framing and to point out details that were not expected.
Participant-selected images
Participant-selected images can give participants more control. They decide what to bring or create, which can reveal priorities the researcher may not have predicted. This can be useful in studies of identity, home life, work routines, place, memory, or belonging.
The trade-off is that images may vary widely across participants. Analysis then needs to focus not only on image content but also on selection: why this image, why now, and why not something else?
Analysing Visual Data
Analysing visual data means looking carefully at the visual material, its context, and the explanations attached to it. The researcher may analyse composition, content, selection, caption, sequence, discussion, production context, and how the image connects to other data.
A visual analysis should avoid treating images as simple proof. A photograph of an empty classroom does not automatically show lack of use. It may have been taken before class, after class, during a break, or because the participant wanted to show the room layout. Context changes interpretation.
Describe before interpreting
The researcher should first describe what is visible. What people, objects, places, colours, text, layout, distance, angle, and arrangement appear? What is central? What is partly hidden? What seems outside the frame?
Description slows down interpretation. It helps the researcher avoid jumping too quickly to broad claims.
Analyse captions and explanations
Captions, interview extracts, diary notes, and participant explanations should be analysed alongside the visual material. A participant’s explanation may challenge what the researcher initially sees.
For example, a photograph of a tidy desk may look like calm organisation. The participant may explain that the desk is tidy only because everything else is hidden on the floor outside the frame. The explanation changes the meaning of the image.
Compare images across a set
Visual data often becomes more meaningful when compared across images. The researcher may compare images from the same participant over time, images from different participants, or images from different settings.
Comparison can show repeated objects, missing spaces, common routes, shared symbols, or different interpretations of similar places. The researcher should keep track of the conditions under which each image was created or selected.
| Analytic focus | Questions to ask |
|---|---|
| Content | What is visible, central, repeated, hidden, or absent? |
| Production | Who made or selected the visual material, when, and for what purpose? |
| Interpretation | How do participants explain the visual, and how does that affect the analysis? |
Link visual data with other materials
Visual data may be linked to field notes, interviews, diaries, documents, or observation records. A map created by a participant can be compared with field notes in qualitative research. A visual diary can be read alongside interview discussion. A poster can be compared with organisational documents.
These links should be documented so the researcher can trace how the interpretation was built.
Report images carefully
Not every image used in analysis should appear in a report. Some images contain identifying information, private spaces, or details that participants did not want shared. The researcher may describe an image rather than reproduce it.
When images are included, the report should explain how they were produced, why they were selected, and what analytic point they support.
Examples of Visual Methods in Qualitative Research
Examples help show how visual methods can be adapted to different research questions. In each case, the visual task has a clear purpose and is connected to analysis.
Example 1: Photo elicitation about student study spaces
Students take three photographs of places where they study during a normal week. In a follow-up interview, they explain what each place makes easier or harder, what is outside the frame, and why they chose those images.
The analysis may show how study routines are shaped by noise, privacy, shared space, lighting, family responsibilities, and access to materials.
Example 2: Mapping access to community services
Participants annotate a local map to show routes they use, places they avoid, services they trust, and points where they feel uncertain. The map becomes both a visual record and an interview prompt.
The data may reveal practical routes, informal boundaries, transport barriers, and differences between official service locations and lived access.
Example 3: Visual diaries of workplace routines
Participants create a one-week visual diary of objects, spaces, or screens that shape their workday. Each image includes a short caption about what was happening and why the item was included.
The analysis may show hidden coordination work, repeated interruptions, improvised tools, and the material organisation of everyday work.
Example 4: Analysing public campaign posters
A researcher studies a set of public campaign posters from several years. The analysis examines images, slogans, layout, colour, target audience, and how responsibility is assigned.
This approach connects visual methods with document analysis because the posters are existing visual documents rather than participant-created data.
Conclusion
Visual methods in qualitative research expand what can be collected, discussed, and analysed. They are useful when images, places, objects, design, memory, movement, or material routines are part of the research question.
Good visual research does not treat images as decoration or simple proof. It asks who created or selected the visual material, what it shows, what it leaves out, how participants interpret it, and how it connects to wider data. With clear design and careful analysis, visual methods can make experience, context, and representation visible in ways that words alone may not capture.
FAQs on Visual Methods in Qualitative Research
What are visual methods in qualitative research?
Visual methods in qualitative research use images, drawings, maps, photographs, videos, objects, diagrams, or other visual materials to collect, discuss, or analyse qualitative data.
What are examples of visual methods?
Examples include photo elicitation, participant photography, visual diaries, mapping, drawing, collage, video diaries, screenshot analysis, object-based interviews, and analysis of posters, websites, or public images.
When should visual methods be used?
Visual methods should be used when the research question concerns place, objects, routines, memory, representation, identity, public communication, design, or experiences that are difficult to explain through words alone.
How do you analyse visual data qualitatively?
Visual data can be analysed by describing what is visible, examining context and production, analysing captions or interview explanations, comparing images across a set, and linking visual material with other data.
Can visual methods be combined with interviews?
Yes. Visual methods are often combined with interviews through photo elicitation, mapping interviews, object-based interviews, or visual diary follow-ups. The image supports discussion, while the participant explanation helps interpret it.


