Statistical Software

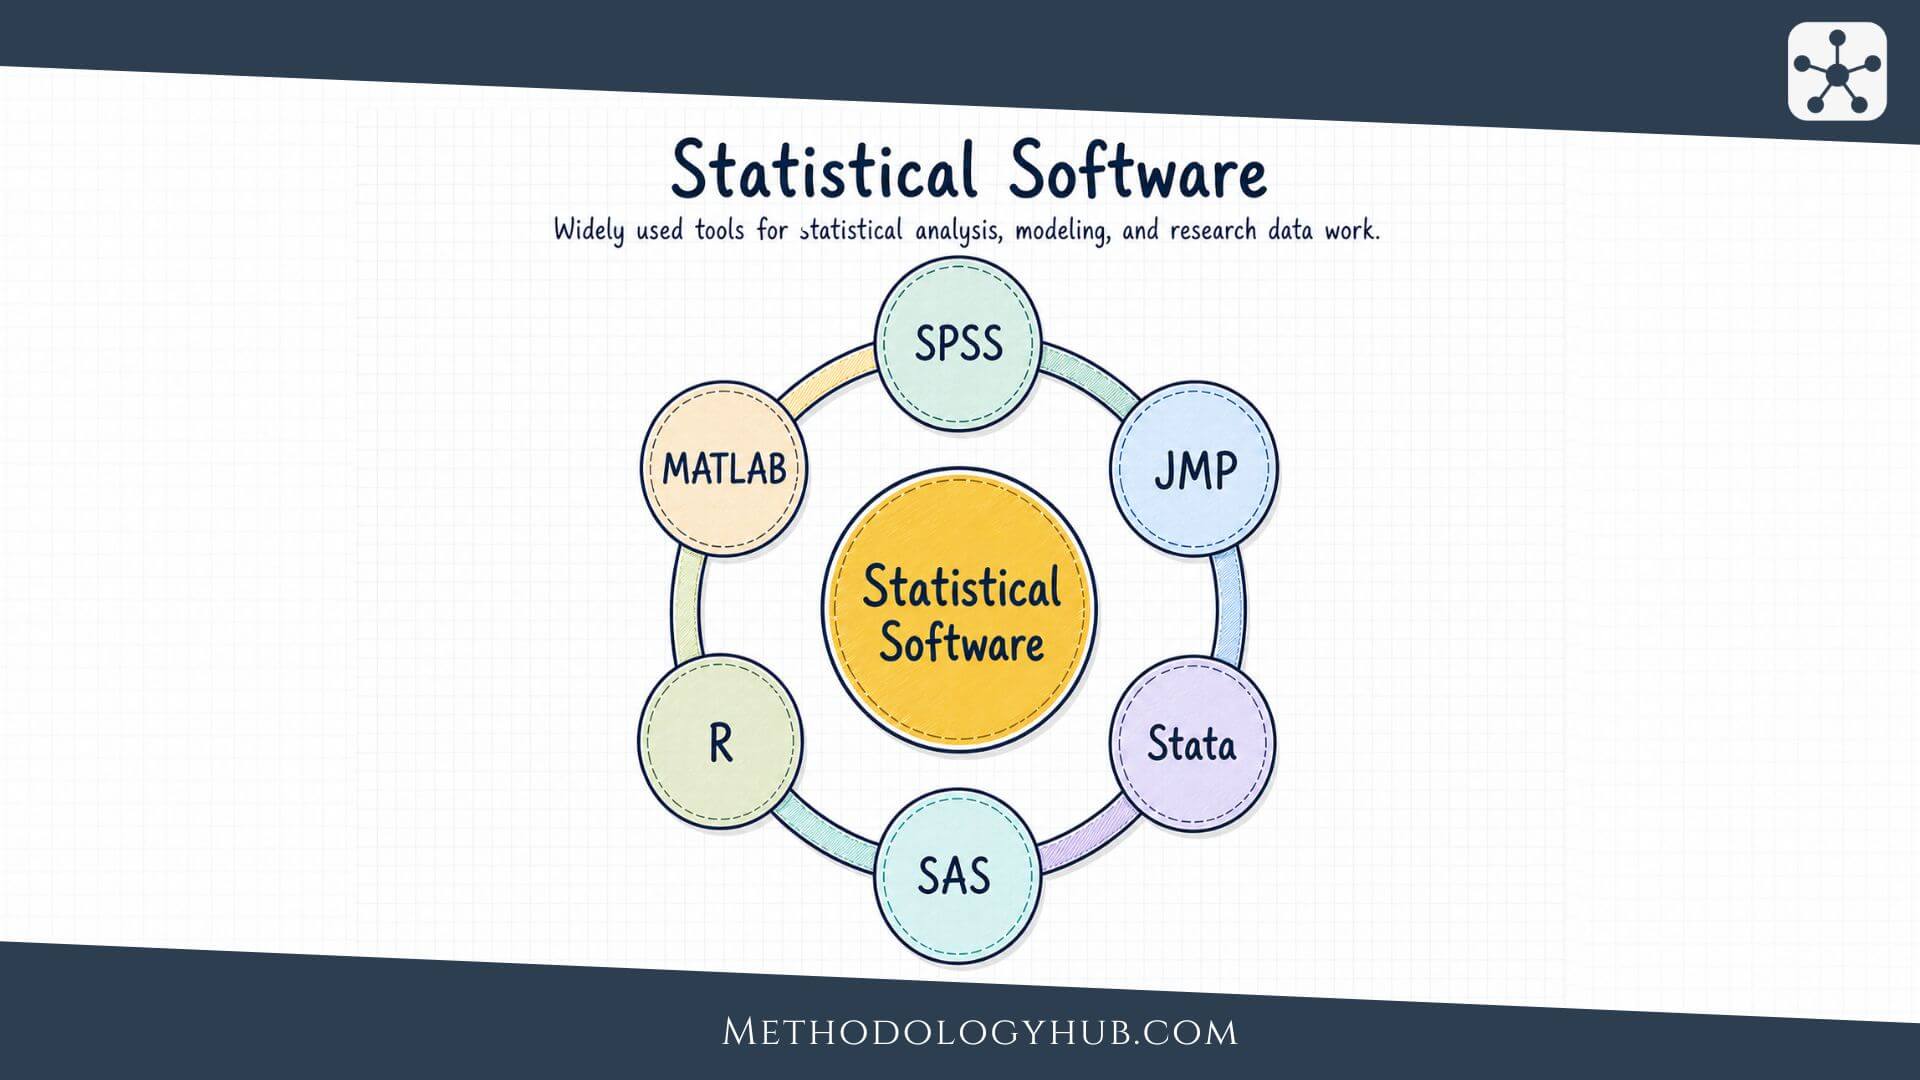
Statistical software overview: This list contains the most used and cited statistical tools still in active development in 2026. Compare free, open source, and paid options for researchers, students, or data scientists.

Our independence: MethodologyHub.com is an independent research resource. We do not develop or sell software. Our evaluations aim to provide unbiased information, with a preference for open-source tools whenever possible.

Best Tools for Statistics Compared

Find the right tool for your research - for students, independent researchers, teams, and institutions.

EViews

EViews / S&P Global · since 1994
License / modelProprietary
Based inUSA
Main office / addressUnited States, EViews
Pricing$$
Ease of useModerate
PlatformDesktop
Student pricingFree and discounted
CategoriesData Analysis, Statistics
Free TrialFree limited version
SubscriptionYes
PerpetualYes
OSWin, Mac

EViews is statistical software developed in the USA by Quantitative Micro Software, now part of S&P Global since 1994. It is developed for Windows and Mac desktop workflows.

It is commonly used for econometric analysis, forecasting, time series analysis, panel data, regression diagnostics, model estimation, and economic research. It is especially relevant for economists, finance researchers, central-bank analysts, policy analysts, and students working with macroeconomic or financial time series. It is particularly associated with applied econometrics and forecasting workflows.

Student offer details Student Version Lite is free with usage limits; University Edition offers a paid student/academic option.

Capabilities Time series analysis, Charts and diagrams, Survival analysis

GNU PSPP

GNU Project · since 1998
License / modelOpen Source
Based inUSA
Main office / addressUnited States, GNU / Free Software Foundation stewardship
PricingFree
Ease of useModerate
PlatformDesktop
Student pricingFree
CategoriesData Analysis, Statistics
Free TrialTool is free
SubscriptionNo
PerpetualYes
OSWin, Mac, Linux

GNU PSPP is statistical software developed in the global GNU free-software community by the GNU Project since 1998. It is developed for Windows, Mac, and Linux desktop environments.

It is commonly used for sampled data analysis, SPSS-like syntax, descriptive statistics, data transformation, basic modelling, reliability analysis, and open-source teaching contexts. It is especially relevant for educators, students, researchers with simple survey-style datasets, and users seeking a free software alternative inspired by SPSS workflows. It is lighter in scope than many commercial packages, but it is useful for transparent and accessible statistical instruction.

Student offer details Free software, including for students.

Capabilities Cluster analysis

gretl

The gretl team · since 2000
License / modelOpen Source
Based inOther
Main office / addressDistributed open, source project; no single corporate headquarters
PricingFree
Ease of useModerate
PlatformDesktop
Student pricingFree
CategoriesData Analysis, Statistics
Free TrialTool is free
SubscriptionNo
PerpetualYes
OSWin, Mac, Linux

gretl is statistical software developed in an international academic open-source context by the gretl team, including contributors associated with Wake Forest University and Università Politecnica delle Marche since 2000. It is developed for Windows, Mac, and Linux desktop environments.

It is commonly used for econometrics, regression modelling, time series analysis, forecasting, scripting, data handling, and open-source teaching in quantitative methods. It is especially relevant for economics students, econometrics instructors, applied researchers, and analysts who want a lightweight open-source alternative for empirical economic work. Its name stands for GNU Regression, Econometrics and Time-series Library, reflecting its focus on econometric workflows.

Student offer details Free software, including for students.

Capabilities Time series analysis, Charts and diagrams

IBM SPSS Statistics

IBM · since 1968
License / modelProprietary
Based inUSA
Main office / addressUnited States, IBM
Pricing$$$
Ease of useEasy
PlatformCloud, Desktop
Student pricingDiscounted
CategoriesData Analysis, Statistics
Free Trial14-day
SubscriptionYes
PerpetualYes
OSWin, Mac, Linux, Cloud

IBM SPSS Statistics is statistical software developed in the USA by IBM, with roots in the original SPSS project since 1968. It is developed for Windows, Mac, Linux, and cloud-connected workflows.

It is commonly used for social science research, survey analysis, institutional reporting, classification, data preparation, and menu-driven statistical procedures. It is especially relevant for universities, psychology departments, education researchers, healthcare analysts, and organizations that need a familiar graphical workflow. Its syntax layer also allows repeatable analysis beyond point-and-click use.

Student offer details Student GradPack editions are available through authorized vendors; eligibility and region conditions apply.

Capabilities Time series analysis, Charts and diagrams, Survival analysis, Cluster analysis, Discriminant analysis

jamovi

The jamovi project · since 2017
License / modelOpen Source
Based inOther
Main office / addressAustralia, jamovi project
PricingFree
Ease of useEasy
PlatformCloud, Desktop
Student pricingFree
CategoriesData Analysis, Statistics
Free TrialTool is free
SubscriptionNo
PerpetualYes
OSWin, Mac, Linux, Cloud

jamovi is statistical software developed in an international open-source context, commonly cited with Sydney, Australia for publication purposes by the jamovi project since 2017. It is developed for Windows, Mac, Linux, and cloud workflows.

It is commonly used for introductory statistics, teaching, descriptive analysis, common inferential procedures, clean output tables, and accessible GUI-based statistical learning. It is especially relevant for students, instructors, psychology departments, social science programs, and users moving from spreadsheets into formal statistical analysis. It is built on top of the R statistical language, giving users a friendly interface while retaining links to the broader R ecosystem.

Student offer details Free software, including for students.

JASP

JASP Team / University of Amsterdam · since 2015
License / modelOpen Source
Based inEU
Main office / addressAmsterdam, Netherlands, University of Amsterdam
PricingFree
Ease of useEasy
PlatformCloud, Desktop
Student pricingFree
CategoriesData Analysis, Statistics
Free TrialTool is free
SubscriptionNo
PerpetualYes
OSWin, Mac, Linux, Cloud

JASP is statistical software developed in the Netherlands by the JASP Team with support from the University of Amsterdam since 2015. It is developed for Windows, Mac, Linux, and browser/cloud workflows.

It is commonly used for accessible frequentist statistics, Bayesian statistics, teaching, transparent output, reproducible analysis, and graphical statistical reporting. It is especially relevant for students, instructors, psychology researchers, social scientists, and users who want a modern free interface without writing code. It is often positioned as an approachable alternative for teaching statistics while still offering advanced Bayesian options.

Student offer details Free software, including for students.

Capabilities Time series analysis, Charts and diagrams, Survival analysis, Cluster analysis, Discriminant analysis

JMP

JMP Statistical Discovery LLC · since 1989
License / modelProprietary
Based inUSA
Main office / addressUnited States, JMP Statistical Discovery
Pricing$$
Ease of useModerate
PlatformDesktop
Student pricingFree
CategoriesData Analysis, Data Visualization, Statistics
Free Trial30-day
SubscriptionYes
PerpetualNo
OSWin, Mac

JMP is statistical software developed in the USA by JMP Statistical Discovery LLC, originally launched as a SAS product since 1989. It is developed for Windows and Mac desktop environments.

It is commonly used for interactive visual statistics, exploratory modelling, designed experiments, quality analysis, predictive modelling, and scientific discovery. It is especially relevant for scientists, engineers, quality teams, laboratory groups, and analysts who prefer visual exploration over purely command-based workflows. Its strength is the tight connection between statistical output and interactive graphics.

Student offer details JMP Student Edition is free for eligible students, educators and academic researchers; annual eligibility renewal applies.

Capabilities Time series analysis, Charts and diagrams, Survival analysis, Cluster analysis, Discriminant analysis

MATLAB

MathWorks · since 1984
License / modelProprietary
Based inUSA
Main office / addressUnited States, MathWorks
Pricing$$$
Ease of useAdvanced
PlatformDesktop
Student pricingDiscounted
CategoriesData Analysis, Data Visualization, Mathematics, Statistics
Free Trial30-day
SubscriptionYes
PerpetualYes
OSWin, Mac, Linux

MATLAB is statistical software developed in the USA by MathWorks since 1984. It is developed for Windows, Mac, and Linux desktop environments.

It is commonly used for numerical computing, engineering statistics, simulation, matrix-based analysis, visualization, time series work, signal processing, and scientific programming. It is especially relevant for engineers, applied scientists, laboratory researchers, quantitative analysts, and university departments with technical computing curricula. It is broader than a pure statistics package and is often used where statistical analysis is part of a larger computational or engineering workflow.

Student offer details Student Suite licenses are offered for eligible students; included products differ from other editions.

Capabilities Time series analysis, Charts and diagrams, Survival analysis, Cluster analysis, Discriminant analysis

MedCalc

MedCalc Software Ltd · since 1993
License / modelProprietary
Based inEU
Main office / addressBelgium, MedCalc Software
Pricing$
Ease of useEasy
PlatformDesktop
Student pricingDiscounted
CategoriesData Analysis, Statistics
Free Trial15-day
SubscriptionYes
PerpetualYes
OSWin, Mac, Linux

MedCalc is statistical software developed in Belgium by MedCalc Software Ltd since 1993. It is developed for Windows workflows, with Mac and Linux use cases represented through compatibility approaches in the source data.

It is commonly used for biomedical statistics, ROC curve analysis, method comparison, diagnostic test evaluation, regression, survival analysis, and clinical research graphs. It is especially relevant for medical researchers, clinicians, epidemiologists, biostatisticians, diagnostic laboratories, and healthcare organizations. Its interface and procedure set are particularly focused on medical and life-science applications.

Student offer details Academic pricing may be available for students and institutions; confirm current eligibility with the provider.

Capabilities Charts and diagrams, Survival analysis

Minitab

Minitab, LLC · since 1972
License / modelProprietary
Based inUSA
Main office / addressUnited States, Minitab
Pricing$$$
Ease of useEasy
PlatformCloud, Desktop
Student pricingDiscounted
CategoriesData Analysis, Statistics
Free Trial14-day
SubscriptionYes
PerpetualNo
OSWin, Mac, Cloud

Minitab is statistical software developed in the USA by Minitab, LLC since 1972. It is developed for Windows, Mac, and cloud workflows.

It is commonly used for quality improvement, Six Sigma, process capability, design of experiments, control charts, regression, forecasting, and guided statistical decision-making. It is especially relevant for manufacturing teams, quality engineers, operations researchers, business analysts, educators, and organizations standardizing process improvement. Its interface emphasizes guided procedures, which makes it practical for applied industrial statistics and non-programmer analysts.

Student offer details Academic and student licensing is offered; availability and pricing depend on the institution or region.

Capabilities Time series analysis, Charts and diagrams, Survival analysis, Cluster analysis, Discriminant analysis

Orange

University of Ljubljana / Orange community · since 1996
License / modelOpen Source
Based inEU
Main office / addressLjubljana, Slovenia, University of Ljubljana
PricingFree
Ease of useEasy
PlatformDesktop
Student pricingFree
CategoriesData Analysis, Data Visualization, Statistics
Free TrialTool is free
SubscriptionNo
PerpetualYes
OSWin, Mac, Linux

Orange is statistical software developed in Slovenia by the University of Ljubljana and the Orange community since 1996. It is developed for Windows, Mac, and Linux desktop environments.

It is commonly used for visual data mining, exploratory analysis, classification, clustering, regression workflows, visualization, educational machine learning, and no-code analytical pipelines. It is especially relevant for data mining instructors, students, analysts, researchers, and teams that want visual workflows instead of script-first analysis. Its widget-based canvas is useful for demonstrating analytical pipelines and machine-learning concepts.

Student offer details Free software, including for students.

Capabilities Time series analysis, Charts and diagrams, Cluster analysis, Discriminant analysis

OriginPro

OriginLab · since 1992
License / modelProprietary
Based inUSA
Main office / addressUnited States, OriginLab
Pricing$$
Ease of useModerate
PlatformDesktop
Student pricingDiscounted
CategoriesData Analysis, Data Visualization, Statistics
Free Trial21-day
SubscriptionYes
PerpetualYes
OSWin

OriginPro is statistical software developed in the USA by OriginLab since 1992. It is developed for Windows desktop environments.

It is commonly used for scientific graphing, curve fitting, regression, signal processing, laboratory data analysis, peak analysis, publication-quality charts, and technical reporting. It is especially relevant for laboratory scientists, physicists, chemists, engineers, materials researchers, and teams that place strong emphasis on graphical output. It is often selected when statistical analysis and publication-ready scientific plotting need to be tightly integrated.

Student offer details OriginLab offers academic and student purchasing options; verify current eligibility at checkout.

Capabilities Time series analysis, Charts and diagrams, Survival analysis, Cluster analysis, Discriminant analysis

Python / SciPy stack

SciPy community / Python ecosystem · since 2001
License / modelOpen Source
Based inOther
Main office / addressDistributed ecosystem with separate governing organizations; no single headquarters for the complete stack
PricingFree
Ease of useAdvanced
PlatformDesktop
Student pricingFree
CategoriesData Analysis, Data Visualization, Mathematics, Statistics
Free TrialTool is free
SubscriptionNo
PerpetualYes
OSWin, Mac, Linux

Python is used as statistical software in many ways through the SciPy ecosystem, developed by an international open-source community since 2001. It is developed for Windows, Mac, and Linux workflows.

It is commonly used for scientific computing, statistical workflows, notebooks, automation, visualization, numerical analysis, data preparation, and integration with libraries such as pandas, statsmodels, scikit-learn, and matplotlib. It is especially relevant for data scientists, computational researchers, engineers, and analysts who need statistics inside a broader programming environment. Its flexibility is high, but many statistical capabilities depend on the selected library stack.

Student offer details Free software, including for students.

Capabilities Charts and diagrams

R

R Foundation / R Core Team · since 1993
License / modelOpen Source
Based inEU
Main office / addressVienna, Austria, R Foundation
PricingFree
Ease of useAdvanced
PlatformCloud, Desktop
Student pricingFree
CategoriesData Analysis, Data Visualization, Mathematics, Statistics
Free TrialTool is free
SubscriptionNo
PerpetualYes
OSWin, Mac, Linux, Cloud

R is a statistical software environment originally developed in New Zealand by Ross Ihaka and Robert Gentleman and now stewarded by the R Foundation and the R Core Team since 1993. It is developed for Windows, Mac, Linux, and cloud/server environments.

It is commonly used for statistical computing, reproducible research, package-based modelling, data visualization, reporting, simulation, and teaching. It is especially relevant for researchers, statisticians, data scientists, epidemiologists, and academics who need an extensible open-source environment. Its package ecosystem makes it one of the most flexible choices for advanced statistical methods.

Student offer details Free software, including for students.

Capabilities Time series analysis, Charts and diagrams, Survival analysis, Cluster analysis, Discriminant analysis

SAS

SAS Institute · since 1976
License / modelProprietary
Based inUSA
Main office / addressUnited States, SAS Institute
Pricing$$$
Ease of useAdvanced
PlatformCloud, Desktop
Student pricingFree
CategoriesData Analysis, Statistics
Free Trial14-day
SubscriptionYes
PerpetualYes
OSWin, Linux, Cloud

SAS is statistical software developed in the USA by SAS Institute since 1976. It is developed for Windows, Linux, and cloud/server environments.

It is commonly used for enterprise analytics, data management, forecasting, survival analysis, multivariate modelling, reporting, and large-scale statistical workflows. It is especially relevant for clinical research teams, regulated industries, public-sector analysts, enterprise data departments, and organizations that need governed analytics. Its long institutional history makes it one of the most traditional names in statistical computing.

Student offer details Free SAS OnDemand for Academics is available for learning; this does not cover every commercial SAS product.

Capabilities Time series analysis, Charts and diagrams, Survival analysis, Cluster analysis, Discriminant analysis

Stata

StataCorp · since 1985
License / modelProprietary
Based inUSA
Main office / addressUnited States, StataCorp
Pricing$$
Ease of useModerate
PlatformDesktop
Student pricingDiscounted
CategoriesData Analysis, Statistics
Free TrialNo public trial
SubscriptionYes
PerpetualYes
OSWin, Mac, Linux

Stata is statistical software developed in the USA by StataCorp since 1985. It is developed for Windows, Mac, and Linux desktop environments.

It is commonly used for data management, econometrics, biostatistics, panel-data analysis, survey analysis, survival analysis, publication-ready graphs, and reproducible command-based research. It is especially relevant for economists, epidemiologists, policy researchers, political scientists, sociologists, and doctoral students who want a stable workflow with strong documentation. It combines a command language with menus, making it approachable while remaining suitable for advanced empirical research.

Student offer details Student and academic licenses are available; conditions vary by country and edition.

Capabilities Time series analysis, Charts and diagrams, Survival analysis, Cluster analysis, Discriminant analysis

StatCrunch

Pearson Education · since 1997
License / modelProprietary
Based inOther
Main office / addressUnited Kingdom, Pearson, parent provider
Pricing$
Ease of useEasy
PlatformCloud, Desktop
Student pricingDiscounted
CategoriesData Analysis, Statistics
Free TrialCourse-dependent
SubscriptionYes
PerpetualNo
OSWin, Mac, Linux, Cloud

StatCrunch is statistical software developed in the USA by Pearson Education since 1997. It is developed for browser-based cloud workflows across Windows, Mac, and Linux devices.

It is commonly used for introductory statistics education, classroom datasets, descriptive statistics, regression, charts, interactive exploration, and browser-based student analysis. It is especially relevant for students, instructors, online courses, textbook-based learning environments, and users who need lightweight statistical tools in a browser. Its educational focus makes it more suitable for learning and teaching than for large-scale professional statistical programming.

Student offer details StatCrunch is distributed as an educational student tool through Pearson and participating institutions.

Capabilities Charts and diagrams

Statgraphics

Statgraphics Technologies · since 1980
License / modelProprietary
Based inUSA
Main office / addressUnited States, Statgraphics Technologies
Pricing$$
Ease of useEasy
PlatformDesktop
Student pricingDiscounted
CategoriesData Analysis, Statistics
Free Trial30-day
SubscriptionYes
PerpetualYes
OSWin

Statgraphics is statistical software developed in the USA by Statgraphics Technologies since 1980. It is developed for Windows desktop environments.

It is commonly used for industrial statistics, quality control, design of experiments, regression, time series, statistical modelling, data visualization, and process improvement. It is especially relevant for quality professionals, industrial engineers, applied statisticians, operations teams, and training providers that need structured statistical procedures. Its emphasis on applied procedures makes it relevant for business, engineering, and production environments.

Student offer details Academic and student pricing is available for eligible users; trial downloads are separate.

Capabilities Time series analysis, Charts and diagrams, Survival analysis, Cluster analysis, Discriminant analysis

Wolfram Mathematica

Wolfram Research · since 1988
License / modelProprietary
Based inUSA
Main office / addressUnited States, Wolfram Research
Pricing$$
Ease of useAdvanced
PlatformCloud, Desktop
Student pricingDiscounted
CategoriesData Analysis, Data Visualization, Mathematics, Statistics
Free Trial15-day
SubscriptionYes
PerpetualYes
OSWin, Mac, Linux, Cloud

Wolfram Mathematica is statistical software developed in the USA by Wolfram Research since 1988. It is developed for Windows, Mac, Linux, and cloud notebook environments.

It is commonly used for statistical modelling, symbolic computation, numerical computation, visualization, simulations, algorithmic research, time series analysis, and interactive notebooks. It is especially relevant for mathematicians, physicists, computational scientists, engineers, educators, and researchers who need statistics alongside symbolic and numerical computation. Its notebook interface is useful when analysis, code, formulas, explanations, and visual outputs need to live in the same document.

Student offer details Student subscriptions require proof of enrollment and are for nonprofessional use.

Capabilities Time series analysis, Charts and diagrams, Survival analysis, Cluster analysis, Discriminant analysis

Methodology Hub’s Recommendations for Statistical Analysis Software

R leads our recommendations for statistical analysis software. Its statistical methods, programmable workflows and graphics support projects ranging from introductory tests to specialised modelling. IBM SPSS Statistics and Stata are our preferred paid alternatives. For students starting without programming experience, jamovi and JASP offer more accessible interfaces while covering substantial statistical work.

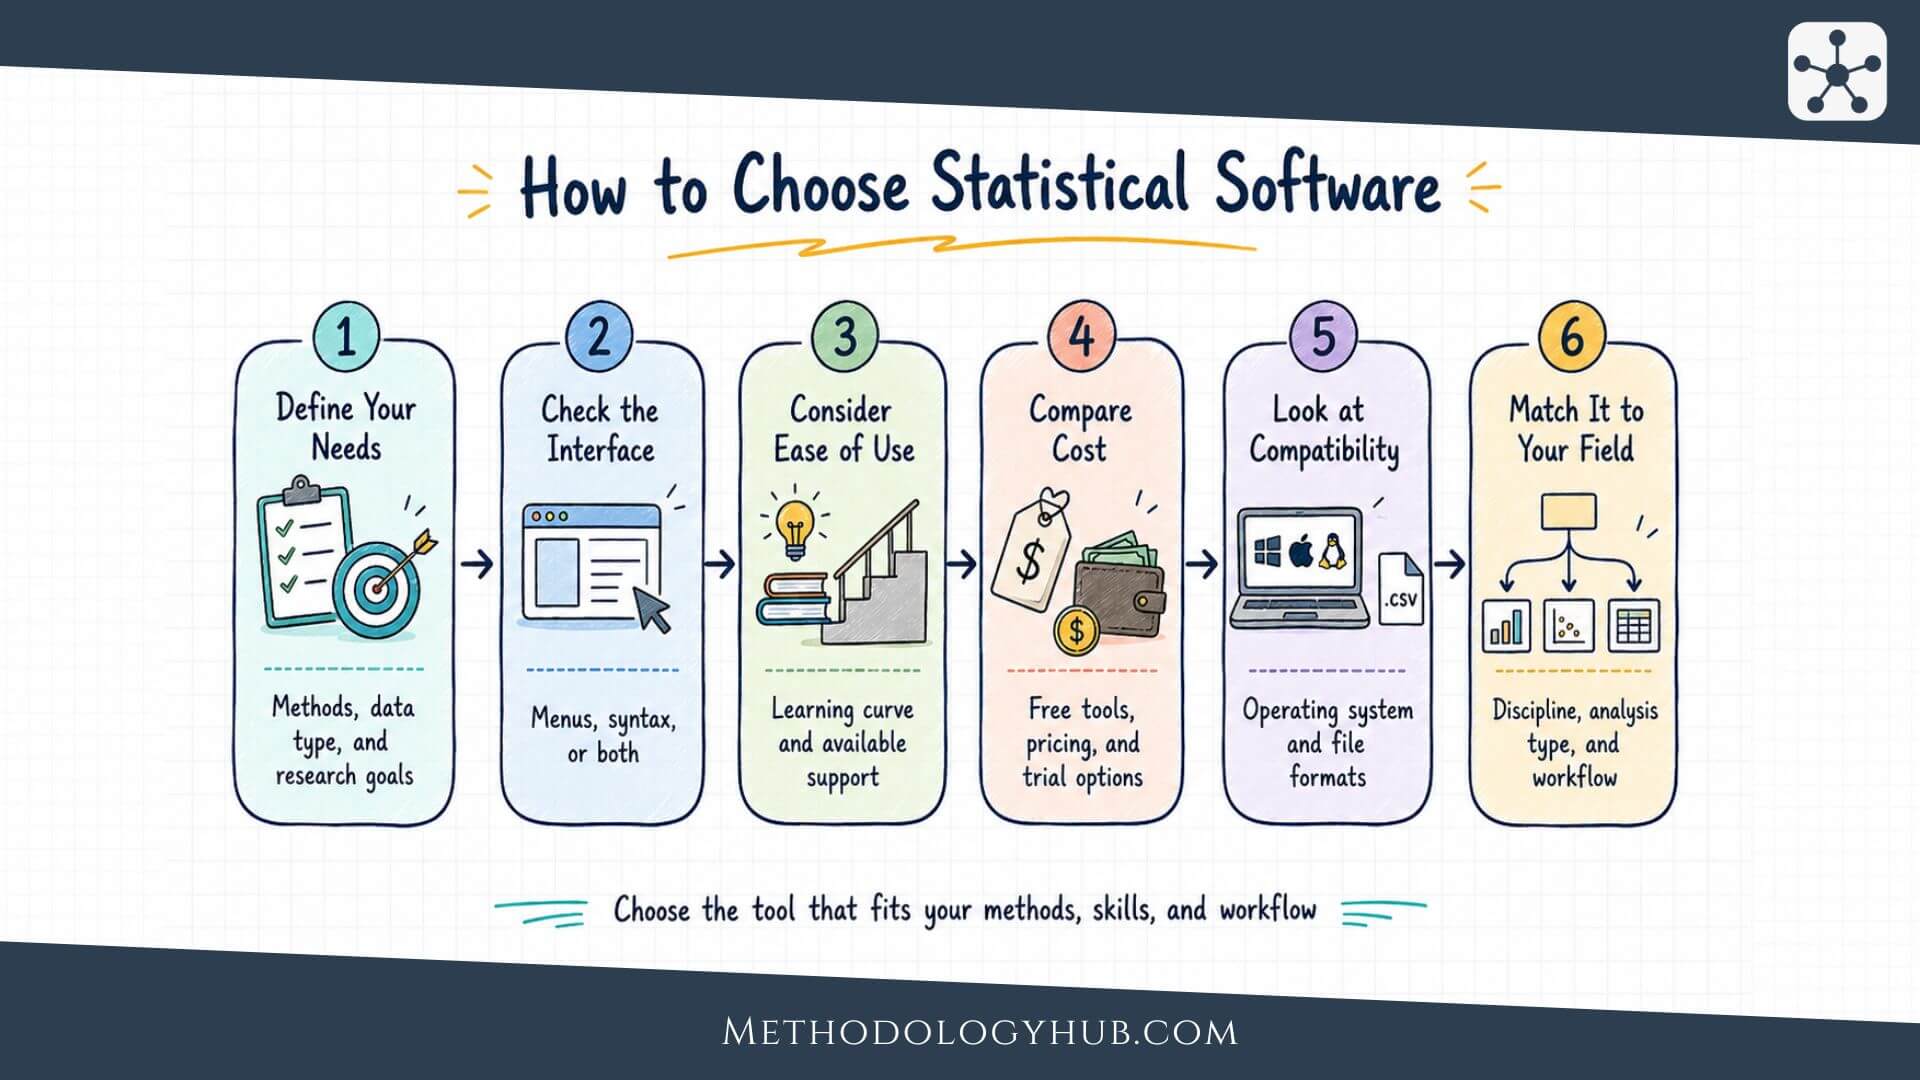
Choosing software for statistical analysis starts with the calculations a study requires. Descriptive statistics, regression, repeated measurements and survey analysis place different demands on an application. We also consider whether researchers can check assumptions, inspect uncertainty and rerun the analysis when data or decisions change. The rankings below reflect those requirements for different users.

How We Compare

Our assessment covers eight criteria. Statistical capabilities and usability determine whether an application suits the work; open-source licensing strengthens its recommendation when those requirements are met.

  • Open source and open research: We value inspectable software, shareable analysis code and reusable project files. Open methods help others examine calculations without requiring researchers to disclose confidential datasets.
  • Cost and continued access: We assess licence fees, subscriptions, additional statistical modules and access after graduation or project completion. A free desktop application can remove recurring costs without restricting routine analyses.
  • Development and long-term support: Documented procedures, maintained releases and a sustainable development organisation matter. Unreviewed AI-generated prototypes and dependence on one developer provide a weak foundation for research software.
  • Support for the research method: Software must handle the study design, variable types and sampling structure. A basic regression menu may be insufficient for clustered observations, complex surveys or longitudinal models.
  • Analytical capabilities: We examine data preparation, statistical tests, model estimation, diagnostics, visualisation and reporting. Relevant options include missing-data methods, confidence intervals and adjustments for multiple comparisons.
  • Protection of research data: We consider where datasets are processed, how access is managed and whether optional cloud or AI services receive research material. Open-source status alone does not establish privacy or compliance.
  • Traceability of the analysis: Scripts or saved analysis settings should preserve transformations, exclusions and model choices. Software versions, package dependencies and random seeds also matter when reproducing results.
  • Usability: Importing data, defining variables and checking output should be understandable. We assess interface clarity, error messages and documentation alongside the programming required for the intended analysis.

Our independence: MethodologyHub.com is an independent research resource. We neither develop nor sell software, and our recommendations generate no commissions or affiliate revenue. We favour capable open-source tools and explain when a paid application offers functions that justify its cost.

Best Overall Statistical Analysis Software

R ranks first for the breadth and flexibility of its statistical environment. SPSS takes second place for combining extensive procedures with a graphical interface, followed by Stata for its integrated modelling and data-management functions.

  1. R: Our first overall recommendation. Researchers can prepare datasets, fit models, generate plots and repeat calculations through scripts. Its package ecosystem extends the available methods beyond the core installation. We rank R first because researchers can adapt the analysis to the question, including specialised procedures and repeated tasks, without licence fees. That flexibility requires programming and careful selection of packages.

  2. IBM SPSS Statistics: For extensive analysis through menus and syntax. SPSS brings data preparation, statistical testing and modelling into a familiar data-editor environment. Researchers can use graphical controls for routine procedures and retain syntax for repeatable calculations. We place it second for this balance of analytical coverage and accessibility. Check the chosen licence: advanced procedures, forecasting and custom tables may require particular editions or additional modules.

  3. Stata: For advanced modelling within one statistical package. Panel-data estimators, survival analysis and causal-inference procedures make Stata particularly relevant to studies of change, duration and treatment effects. Its commands and do-files support repeatable analysis. We rank it third overall, although it may be the stronger paid choice for a project centred on those methods. The statistical assumptions still need justification regardless of how easily a model runs.

Other alternatives include jamovi, JASP and SAS/STAT. The first two cover many common analyses through graphical interfaces; SAS/STAT provides extensive procedures for more demanding statistical modelling. A narrower application can be sufficient when it covers the study’s actual requirements.

Best Open Source Statistical Analysis Software

R, jamovi and JASP are our three open-source recommendations. R offers the greatest scope for custom analysis, jamovi combines statistical menus with an R-based foundation, and JASP makes frequentist and Bayesian procedures readily accessible.

  1. R: For flexible statistical computing. R supports calculations that can be inspected, modified and reused across datasets. Researchers can combine data transformations, statistical models and visualisation in a single script. This makes it our leading open-source choice for work requiring substantial control over the analysis. Save the script and record the software environment; an output table alone does not preserve how it was produced.

  2. jamovi: For statistics with a graphical interface. Its menus cover descriptive statistics, t-tests, ANOVA, regression and factor analysis, with modules extending the available methods. Projects retain data, analysis settings and results together. We rank jamovi second because it combines useful analytical coverage with a manageable interface. R integration offers a route into programming when the built-in controls no longer cover the task.

  3. JASP: For frequentist and Bayesian analysis. JASP provides both approaches for procedures including t-tests, ANOVA and regression. Researchers can change model settings and inspect updated tables and plots through its graphical workspace. We recommend it particularly when Bayesian inference is part of the study. Its position reflects that useful combination, rather than an assumption that every method has identical options in both frameworks.

Among further open-source alternatives, Orange is useful for visual data exploration, clustering and machine learning. We place the three ranked tools ahead for general statistical research because their workflows more directly support hypothesis tests and model-based inference. Orange becomes more relevant when visual data mining is the central task.

Best Statistical Analysis Software for Students

jamovi ranks first for students beginning statistical analysis, followed by JASP and R. All three provide free access. The order prioritises learning statistical methods before programming; for students already comfortable writing code, R would move to first place.

  1. jamovi: Our first choice for introductory statistics. Students can import a dataset, define variables and run common statistical tests without first learning a programming language. Analyses update as settings change, helping students examine the consequences of their choices. We favour jamovi for this direct connection between selecting a procedure and inspecting its output. Its saved projects also keep assignments available for later review.

  2. JASP: For learning different approaches to inference. Students can examine frequentist results and Bayesian evidence within the same application. Tables, plots and annotated output help organise the interpretation of an analysis. JASP takes second place because it supports that comparison without requiring code. Courses introducing Bayesian tests may reasonably prefer it to jamovi, depending on the procedures being taught.

  3. R: For developing reusable analytical skills. Writing an analysis as code lets students revise calculations, repeat models and create tailored figures. Those capabilities become especially useful in dissertations involving several datasets or specialised methods. R ranks third here because programming adds to the initial learning task, not because its statistical functions are weaker. Access continues after graduation without a student licence.

SPSS, Stata and Orange are additional alternatives. SPSS is useful for menu-based analysis with a route into syntax; Stata deserves consideration for econometrics and longitudinal research; Orange supports visual exploration and machine learning. Our student top three already provide substantial statistical functionality without a software purchase.

Best Statistical Analysis Software for Research Teams

R ranks first for teams sharing analysis code and reproducible results. Stata follows for coordinated work through do-files, with SPSS Statistics third for teams combining menu-based analysis with shared syntax. These workflows require agreed data versions and file management.

  1. R: For collaborative analysis through shared code. Researchers can review scripts, divide analytical tasks and rerun colleagues’ calculations. External version control records code changes. For a managed shared editor, Posit Workbench provides project sharing in RStudio Pro. R is open source; Workbench is a separate commercial product, and its live collaboration is not a standard R feature.

  2. Stata: For reviewing and reproducing a team’s calculations. Do-files record data preparation, models and reporting steps that colleagues can inspect and rerun. Data-signature checks help identify whether the input dataset has changed. Stata takes second place for these reviewable analytical workflows. Teams coordinate files and code through shared storage or version control; this is not simultaneous editing of a common dataset.

  3. IBM SPSS Statistics: For handing over documented analyses. Researchers can generate syntax from analysis dialogs, save it and pass the complete sequence of commands to colleagues. This makes work easier to review than sharing output tables alone. We rank SPSS third for teams combining graphical analysis with reproducible handovers. Shared editing and version control need to be organised separately.

jamovi, JASP and SAS/STAT are alternatives. Saved analysis projects can help colleagues review work in jamovi or JASP, while SAS/STAT supports more extensive statistical programming.

Best Statistical Analysis Software for Educational Institutions

R leads our institutional ranking for supporting teaching and advanced research across disciplines. SPSS follows for broad statistical work through menus and syntax, while Stata takes third for its specialised modelling procedures.

  1. R: For teaching and research across levels. Departments can use R for introductory calculations, simulations and advanced models while sharing analysis scripts with students and colleagues. Its extensibility allows different courses to build on the same statistical environment. We rank it first for that range. Institutions should document the packages used in teaching and research so collaborators can reconstruct the relevant analysis environment.

  2. IBM SPSS Statistics: For accessible quantitative coursework and research. Data preparation, statistical tests and modelling support courses that need substantial analysis without making programming the starting point. Syntax also allows students and staff to record and repeat procedures. We place SPSS second for this combination. Institutional procurement should cover the modules required by actual courses and projects, rather than assume every procedure is included in the base licence.

  3. Stata: For longitudinal, econometric and health research. Its panel-data models, treatment-effect estimators and survival procedures address questions that go beyond a standard comparison of means. Researchers can combine those methods with data preparation and diagnostic checks in do-files. Stata earns its place through this methodological coverage. Departments specialising in these areas may place it ahead of SPSS.

jamovi, JASP and Orange are further alternatives for institutional teaching. jamovi suits introductory statistical courses, JASP supports teaching Bayesian and frequentist inference, and Orange helps demonstrate data-mining workflows. They can complement a broader research environment without requiring every student to begin with the most programmable option.

Best Statistical Analysis Software for Business and B2B

R is our first business recommendation for statistical modelling and repeatable analysis. SPSS ranks second for survey analysis, reporting and forecasting, followed by SAS/STAT for complex modelling requirements.

  1. R: For custom models and recurring analysis. Analysts can write scripts that prepare new business data, rerun calculations and regenerate figures. This is useful when monthly reporting or comparisons across customer groups would otherwise require repeated manual work. We rank R first for combining customisation, automation and statistical breadth. The organisation needs people who can maintain the code and check the models as the data changes.

  2. IBM SPSS Statistics: For survey analysis and structured reporting. Data preparation, custom tables and regression analysis support questions about customer characteristics, preferences and outcomes. Additional procedures cover forecasting, complex samples and conjoint analysis. We rank SPSS second for these practical business functions and its graphical interface. Confirm the required modules before comparing licence costs.

  3. SAS/STAT: For demanding statistical modelling. Mixed models, survival analysis, multiple imputation and survey procedures support projects with complex observations or missing data. Its high-performance procedures also provide options for computationally demanding estimation. SAS/STAT ranks third because these capabilities justify consideration where simpler analysis menus are insufficient. This recommendation concerns the statistical product; other SAS platform services and their costs require separate assessment.

Stata, jamovi and Orange are other alternatives. Stata suits business questions involving panel data or treatment effects, jamovi can cover routine statistical comparisons, and Orange supports visual exploration and predictive modelling. Open-source software is fully represented here through R: a paid licence is not a prerequisite for advanced business statistics.

Find and compare more research software

Compare the most-used and actively maintained research software and academic tools. Explore software solutions for working with scholarly sources and research data, with an emphasis on practical academic workflows, research methods, collaboration, and software features.

Content Analysis Software

Compare tools for coding material, counting categories, and finding patterns across research documents.

Compare tools

Literature Review Software

Explore tools for searching, screening studies, extracting evidence, and organizing reviews.

Compare tools

Mixed Methods Software

Find tools that bring qualitative evidence and numerical data together for integrated analysis.

Compare tools

Qualitative Data Analysis Software

Compare software for coding interviews, field notes, documents, and other qualitative material.

Compare tools

Reference Management Software

Find tools for organizing sources, managing citations, and maintaining a research library.

Compare tools

Statistical Software

Compare options for data analysis, statistical modelling, and reproducible research workflows.

Compare tools

Text Analysis Software

Explore tools for examining word use, language patterns, and large collections of text.

Compare tools

Thematic Analysis Software

Compare tools for developing themes and tracing interpretations across qualitative data.

Compare tools

Transcription Software

Find tools for turning interviews, focus groups, and recordings into editable transcripts.

Compare tools

Writing Assistant Software

Compare tools that support drafting, editing, collaboration, and academic writing.

Compare tools