Methods & Methodology

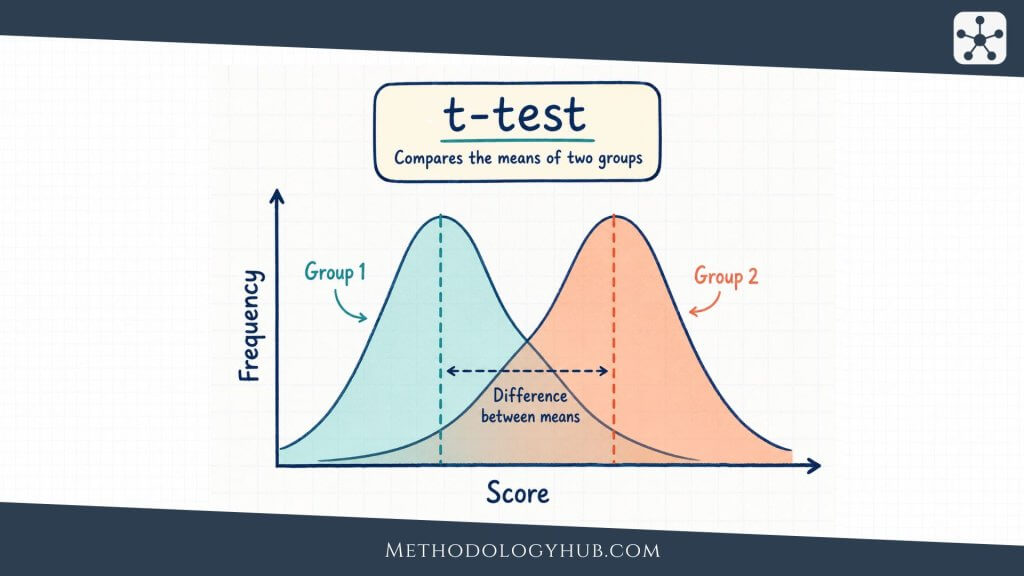
t-test - What is the T-Test - MethodologyHub.com

t-Test: Definition, Types, Interpretation, and Examples

t-Test is a statistical test used to compare means when a research question is about one sample, two independent groups, or two related measurements. It is one of the most familiar procedures in inferential statistics because many studies ask whether an average score, time, measurement, or scale value differs from another average or from a […]

t-Test: Definition, Types, Interpretation, and Examples Read More »
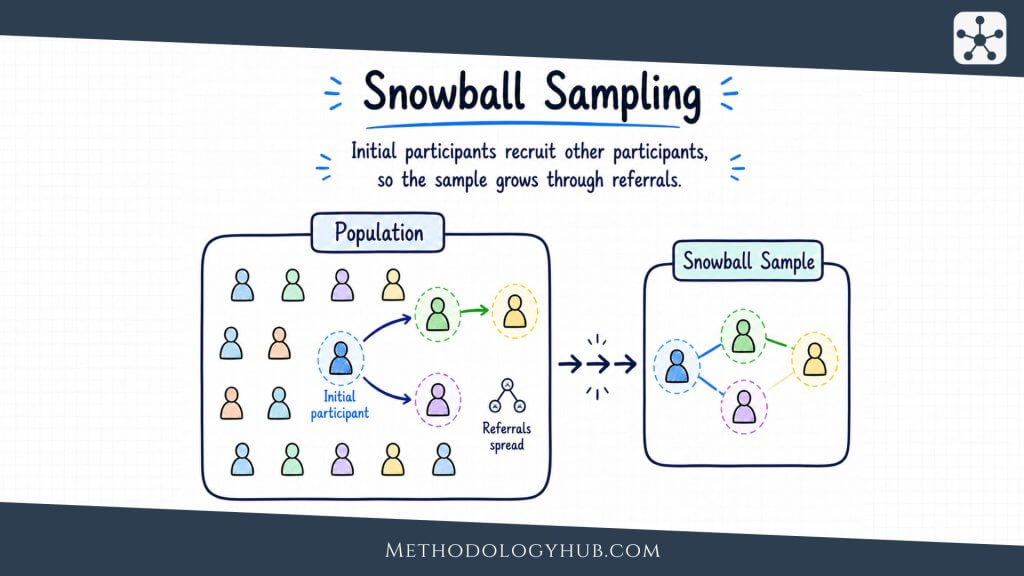
Snowball Sampling - MethodologyHub.com

Snowball Sampling Explained: Uses, Steps, Examples

Snowball sampling is a non-probability sampling method in which existing participants help the researcher reach other people who fit the study criteria. Instead of beginning with a complete list of everyone in the population, the researcher begins with a small number of suitable contacts, asks them for referrals, and gradually builds the sample through those

Snowball Sampling Explained: Uses, Steps, Examples Read More »

Systematic Sampling - MethodologyHub.com

Systematic Sampling: Definition, Steps, and Examples

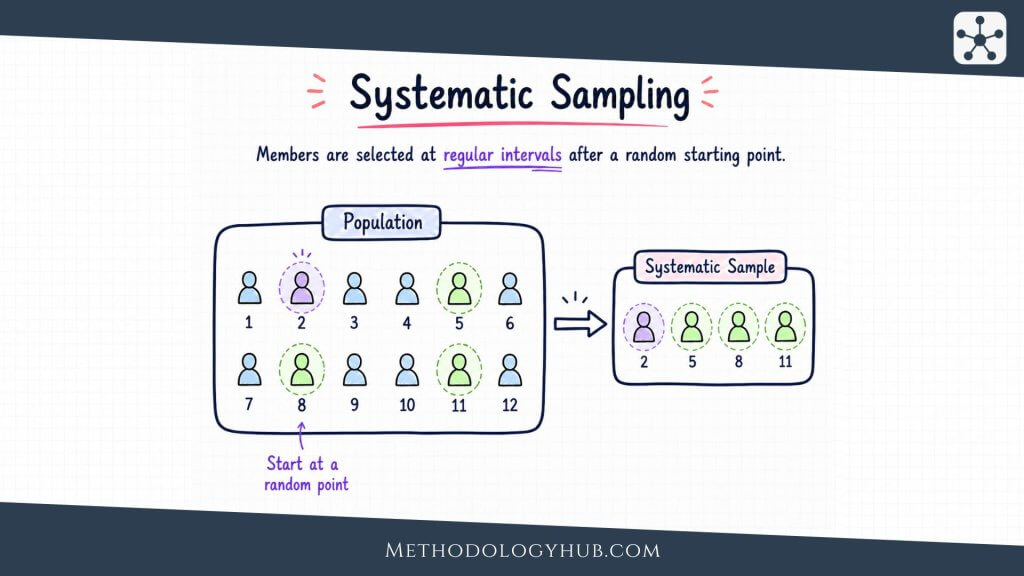
Systematic sampling is a probability-based sampling method in which researchers select units from an ordered list at regular intervals after choosing a random starting point. Instead of drawing every case separately, the researcher decides on a sampling interval and then follows that interval through the sampling frame. The method is popular because it is easy

Systematic Sampling: Definition, Steps, and Examples Read More »

Cluster Sampling - MethodologyHub.com

Cluster Sampling Explained: Types, Steps & Examples

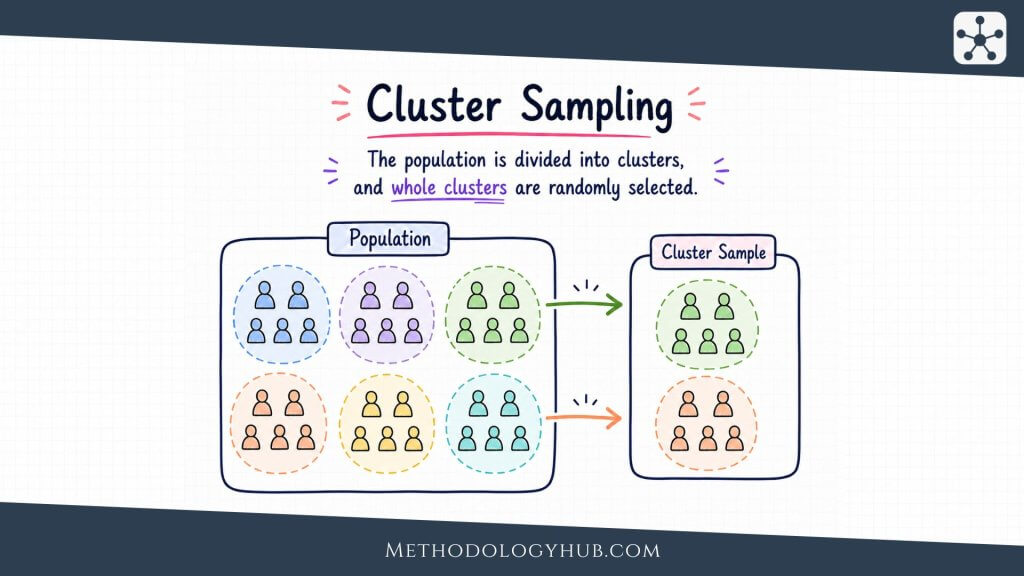
Cluster sampling is a probability-based sampling method in which researchers select groups first, rather than selecting every person, record, household, school, clinic, or observation directly from one long list. These groups are called clusters. Once clusters have been selected, the researcher collects data from all eligible units inside them or samples further within them. This

Cluster Sampling Explained: Types, Steps & Examples Read More »

Purposive Sampling Explained: Types, Uses and Examples

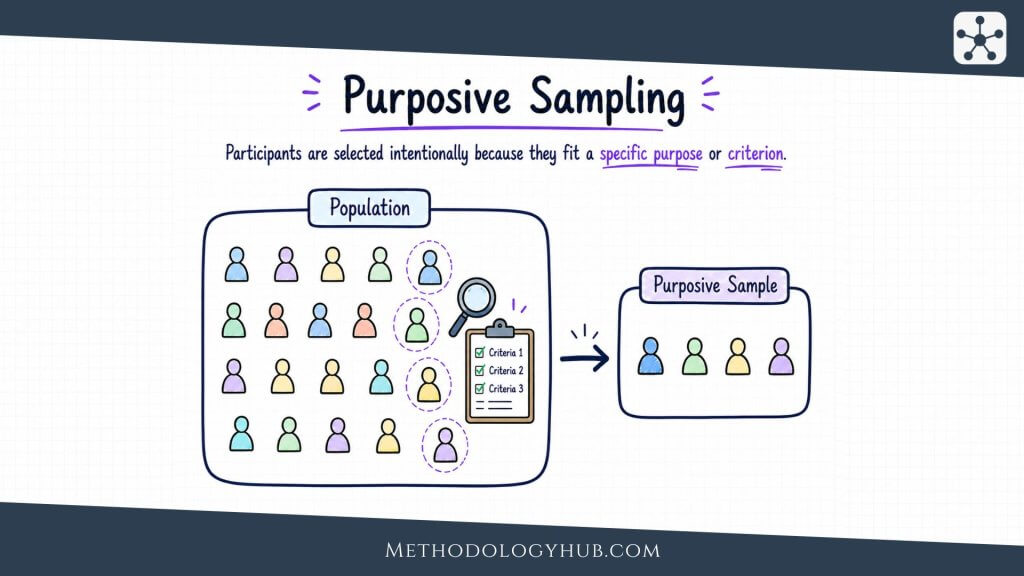
Purposive sampling is a non-probability sampling method in which researchers select people, cases, documents, events, sites, or records because they fit the purpose of the study. Instead of asking chance to decide who enters the sample, the researcher uses clear criteria to find units that can speak directly to the research question. This article explains

Purposive Sampling Explained: Types, Uses and Examples Read More »

Convenience Sampling - MethodologyHub.com

Convenience Sampling: Meaning, Uses, and Examples

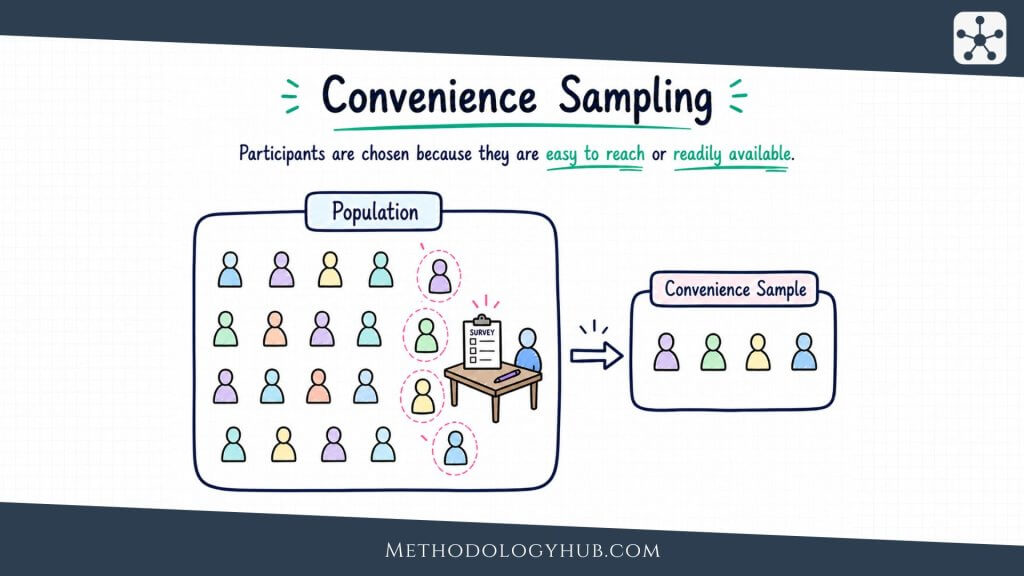
Convenience sampling is a non-probability sampling method in which people, cases, records, places, or observations are selected because they are easy for the researcher to access. Instead of drawing names from a complete list or using a chance-based procedure, the researcher works with the units that are available within a classroom, clinic, organisation, online group,

Convenience Sampling: Meaning, Uses, and Examples Read More »

Stratified Sampling - MethodologyHub.com

Stratified Sampling Explained: Types, Steps & Examples

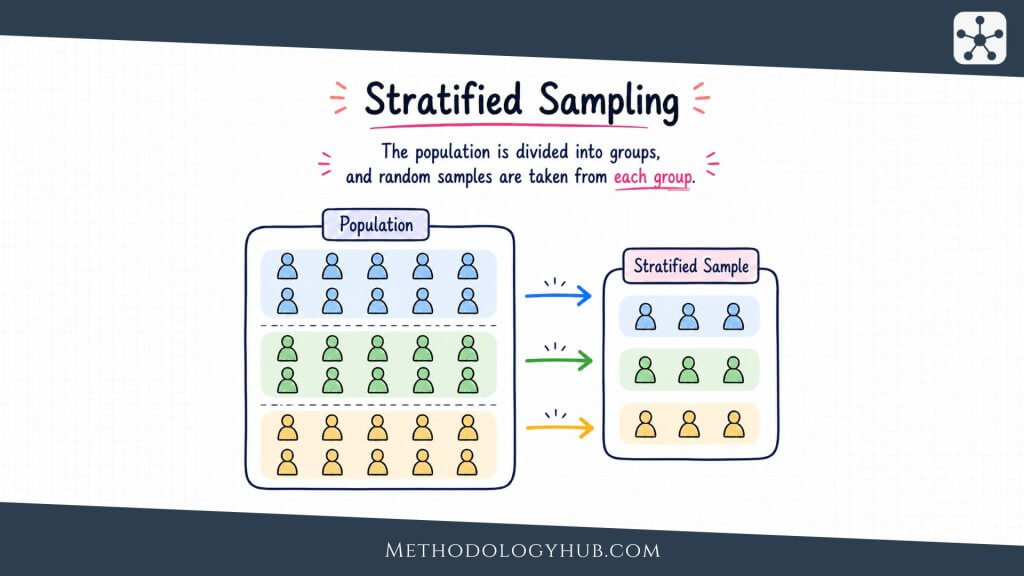
Stratified sampling is a probability-based sampling method in which a population is divided into meaningful subgroups before the sample is selected. These subgroups are called strata. Instead of drawing one sample from the whole population at once, the researcher draws a sample from each stratum, so that important groups are included in a planned way.

Stratified Sampling Explained: Types, Steps & Examples Read More »

Kendall’s Tau: How to Calculate and Interpret It

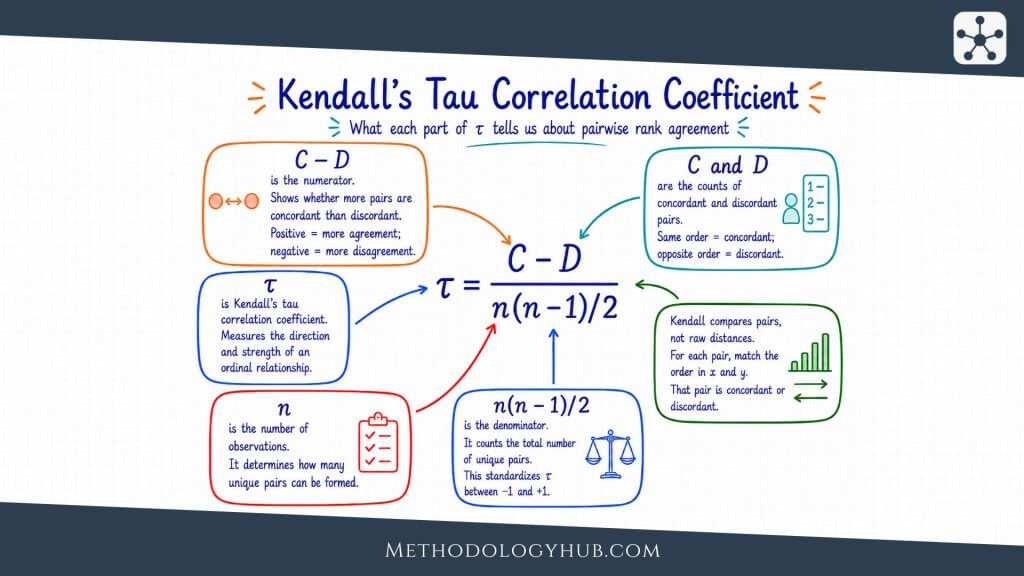
Kendall’s Tau is a rank-based correlation coefficient used in statistical analysis to describe the direction and strength of association between two ordered variables. It is also called Kendall’s rank correlation coefficient, and it is especially useful when a researcher wants to understand whether two sets of observations tend to follow the same order. The idea

Kendall’s Tau: How to Calculate and Interpret It Read More »

Spearman’s Rank Correlation: Formula, Uses & Interpretation

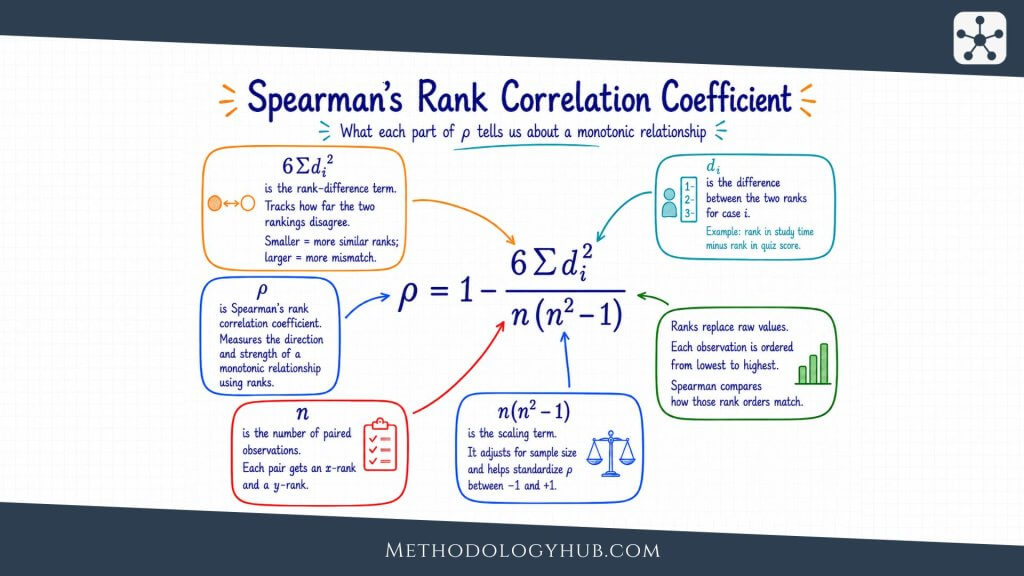
Spearman’s rank correlation is a measure used in statistical analysis to describe the direction and strength of association between two variables after their values have been converted into ranks. It is often written as Spearman’s ρ, Spearman’s rho, or rs, and it is especially useful when the relationship is monotonic rather than strictly linear. In

Spearman’s Rank Correlation: Formula, Uses & Interpretation Read More »