Statistics

Mann-Whitney U Test - MethodologyHub.com

Mann-Whitney U test: Assumptions, Use & Interpretation

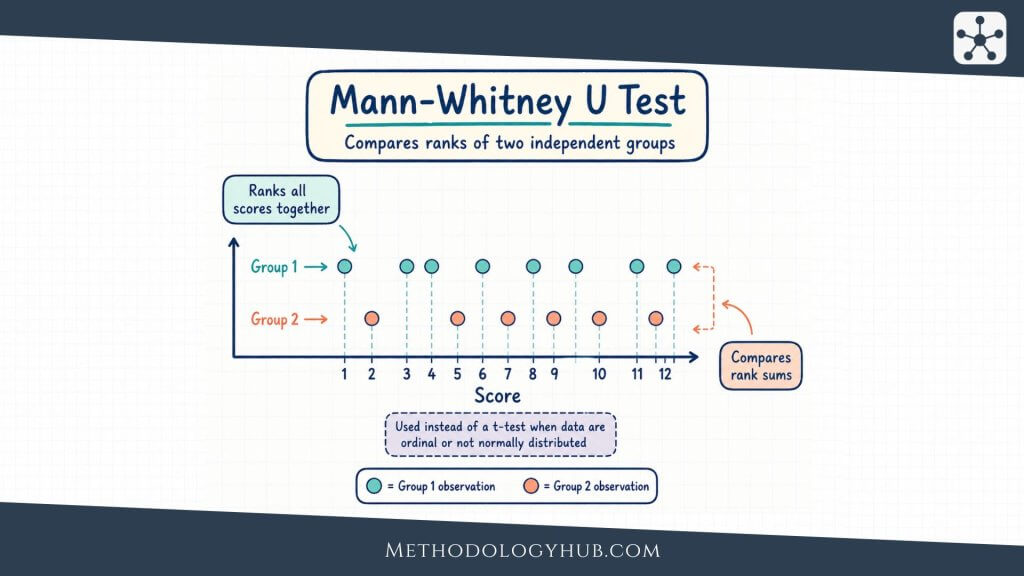
Mann-Whitney U test is a rank-based statistical test used to compare two independent groups when the outcome is ordinal, not normally distributed, or better analysed through ranks than through raw means. It is often introduced as a nonparametric alternative to the independent-samples t-test, although that comparison should be handled carefully because the two tests do […]

Mann-Whitney U test: Assumptions, Use & Interpretation Read More »
Correlation tests - MethodologyHub.com

Correlation Tests Explained: Types, Interpretation, and Examples

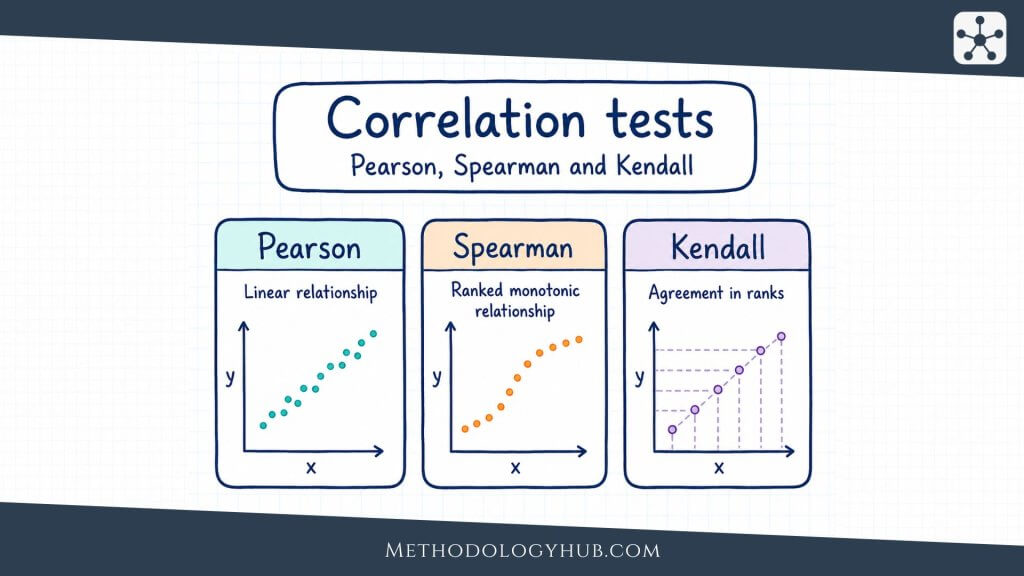
Correlation tests are statistical tests used to examine whether two variables are associated in a population, based on the pattern observed in sample data. They are often used after a researcher has collected paired observations and wants to know whether the relationship seen in a scatterplot, table, or set of ranks is strong enough to

Correlation Tests Explained: Types, Interpretation, and Examples Read More »

Regression tests - MethodologyHub.com

Regression Tests: Assumptions, Use and Interpretation

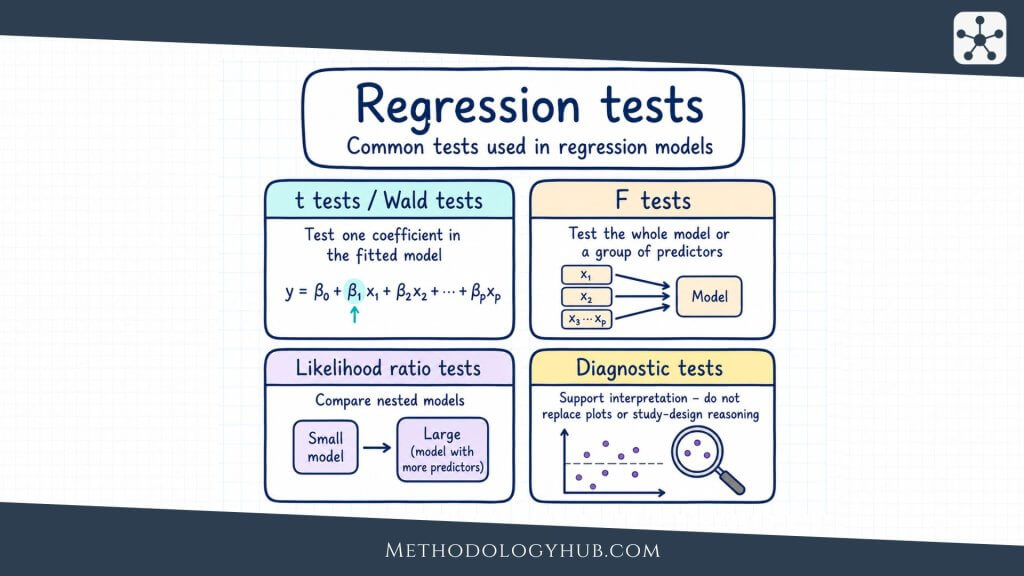
Regression tests are statistical tests used to examine whether a regression model shows a meaningful relationship between an outcome variable and one or more predictor variables. In research, they help answer questions such as whether a predictor has a non-zero coefficient, whether several predictors improve a model, whether the model fits the data well enough,

Regression Tests: Assumptions, Use and Interpretation Read More »

Chi-square test - MethodologyHub.com

Chi-Square Test: Definition, Interpretation, and Examples

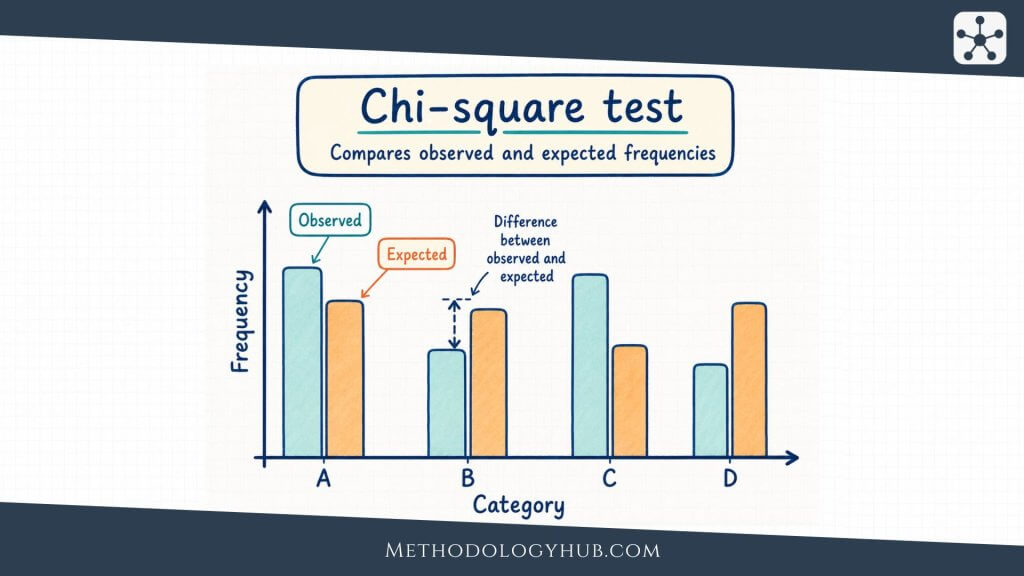
Chi-square test is a statistical test used to analyse categorical data. It helps researchers compare observed counts with expected counts, either to see whether one categorical variable follows an expected pattern or to examine whether two categorical variables are associated. This article explains what the chi-square test is, how the chi-square statistic is calculated, which

Chi-Square Test: Definition, Interpretation, and Examples Read More »

ANOVA - What is the ANOVA - MethodologyHub.com

ANOVA: Definition, Assumptions, Examples & Interpretation

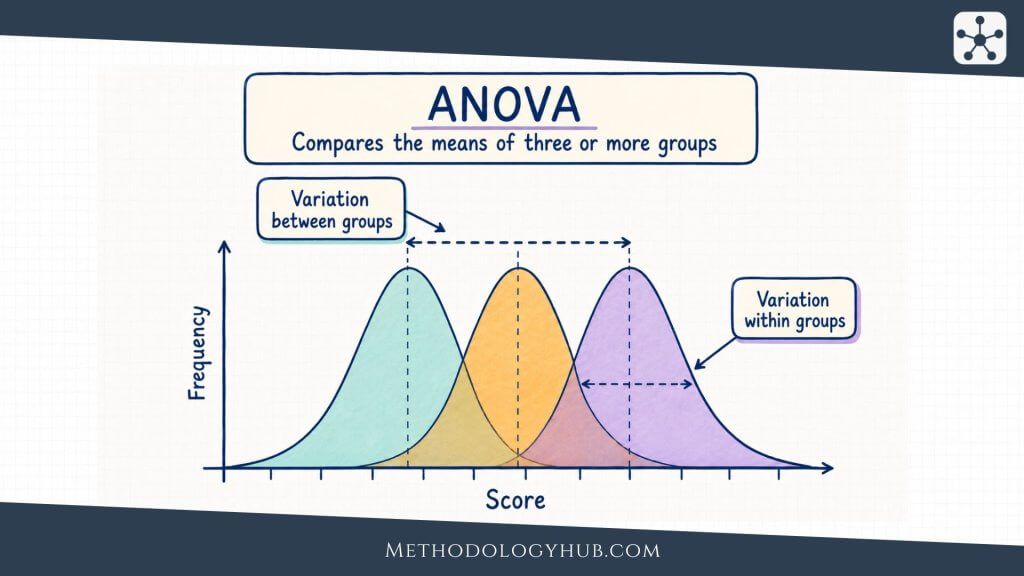
ANOVA, short for analysis of variance, is a statistical test used to compare mean values across groups. It is most often used when a researcher has one numerical outcome, such as a test score, reaction time, income value, plant height, or scale score, and wants to know whether the average outcome differs across three or

ANOVA: Definition, Assumptions, Examples & Interpretation Read More »

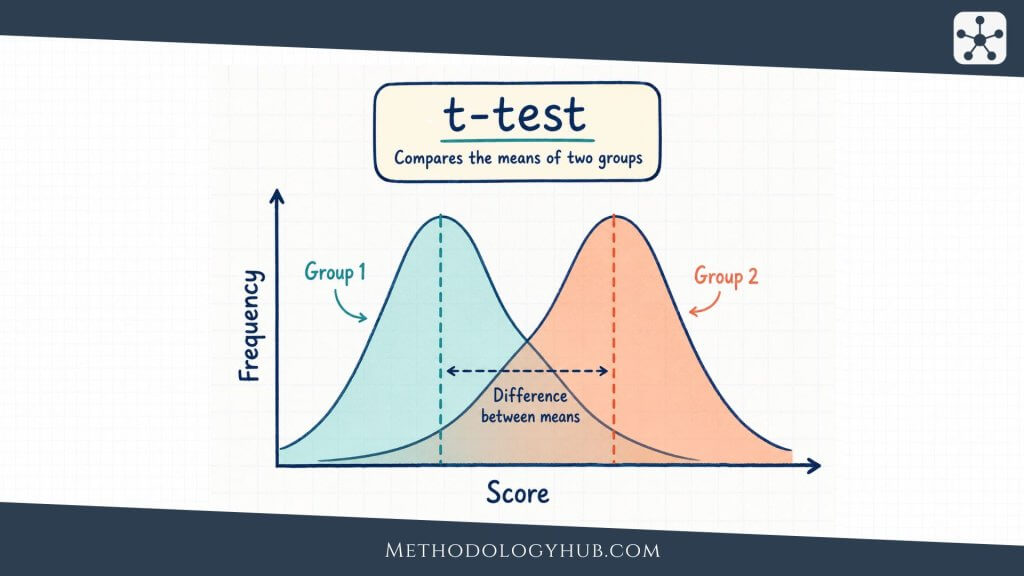
t-test - What is the T-Test - MethodologyHub.com

t-Test: Definition, Types, Interpretation, and Examples

t-Test is a statistical test used to compare means when a research question is about one sample, two independent groups, or two related measurements. It is one of the most familiar procedures in inferential statistics because many studies ask whether an average score, time, measurement, or scale value differs from another average or from a

t-Test: Definition, Types, Interpretation, and Examples Read More »

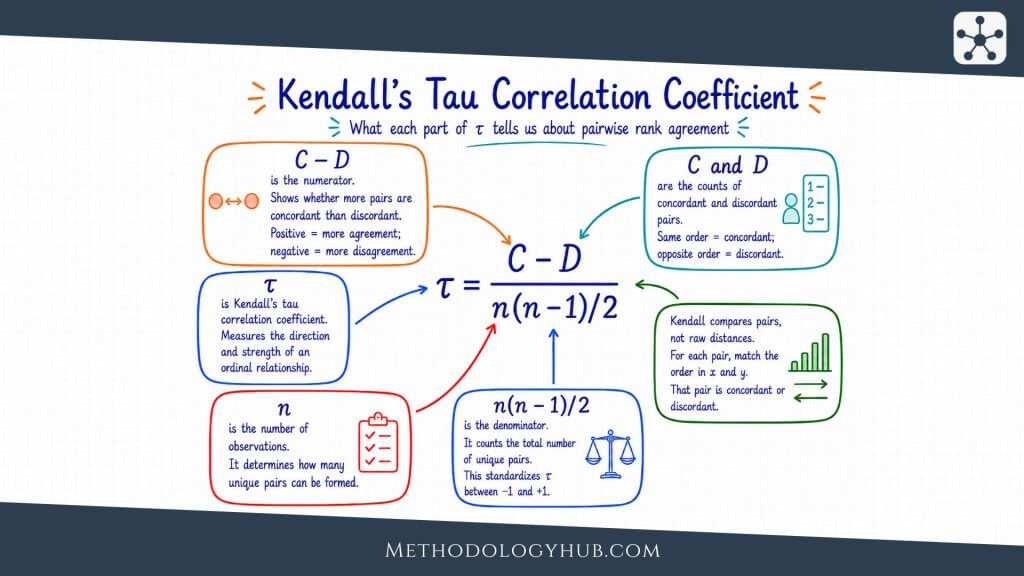
Kendall’s Tau: How to Calculate and Interpret It

Kendall’s Tau is a rank-based correlation coefficient used in statistical analysis to describe the direction and strength of association between two ordered variables. It is also called Kendall’s rank correlation coefficient, and it is especially useful when a researcher wants to understand whether two sets of observations tend to follow the same order. The idea

Kendall’s Tau: How to Calculate and Interpret It Read More »

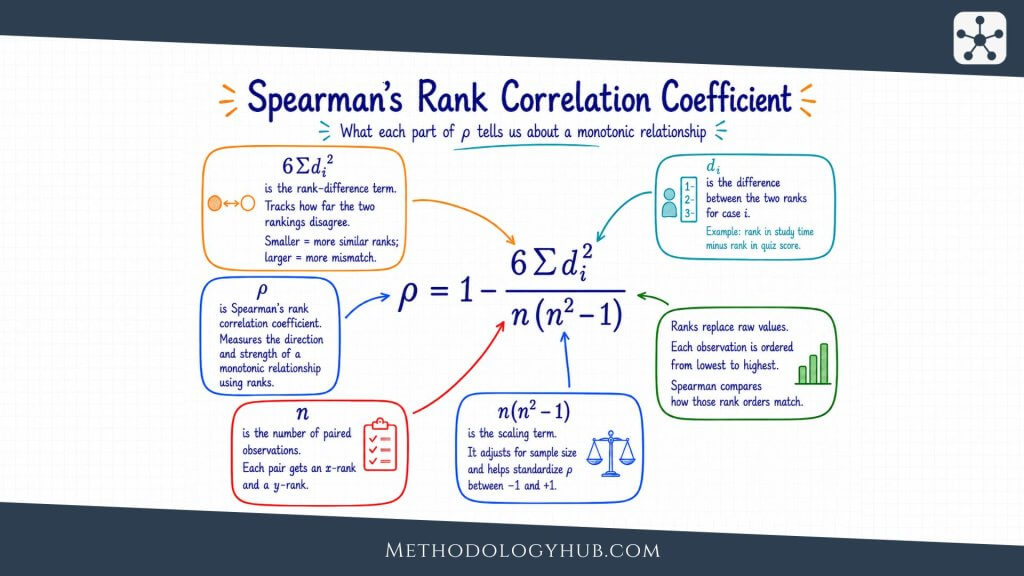
Spearman’s Rank Correlation: Formula, Uses & Interpretation

Spearman’s rank correlation is a measure used in statistical analysis to describe the direction and strength of association between two variables after their values have been converted into ranks. It is often written as Spearman’s ρ, Spearman’s rho, or rs, and it is especially useful when the relationship is monotonic rather than strictly linear. In

Spearman’s Rank Correlation: Formula, Uses & Interpretation Read More »

Pearson Correlation Coefficient - What it is, Formula, and Interpretation - MethodologyHub.com

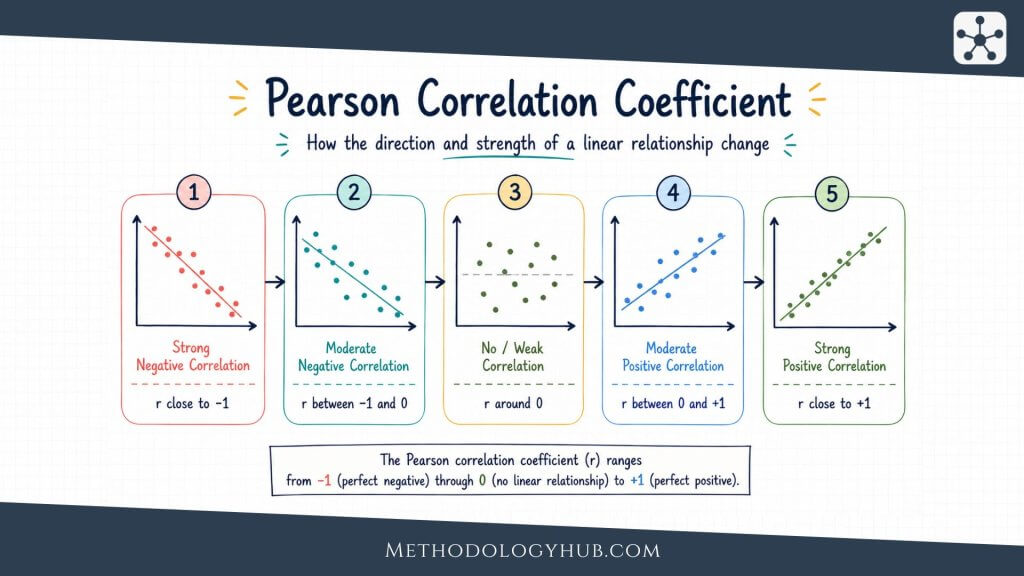
Pearson Correlation Coefficient: How to Calculate and Interpret r

Pearson correlation coefficient is a key measure in statistical analysis used to describe the direction and strength of a linear relationship between two quantitative variables. It is usually written as r, and it gives researchers a compact way to say whether two sets of values tend to move together, move in opposite directions, or show

Pearson Correlation Coefficient: How to Calculate and Interpret r Read More »