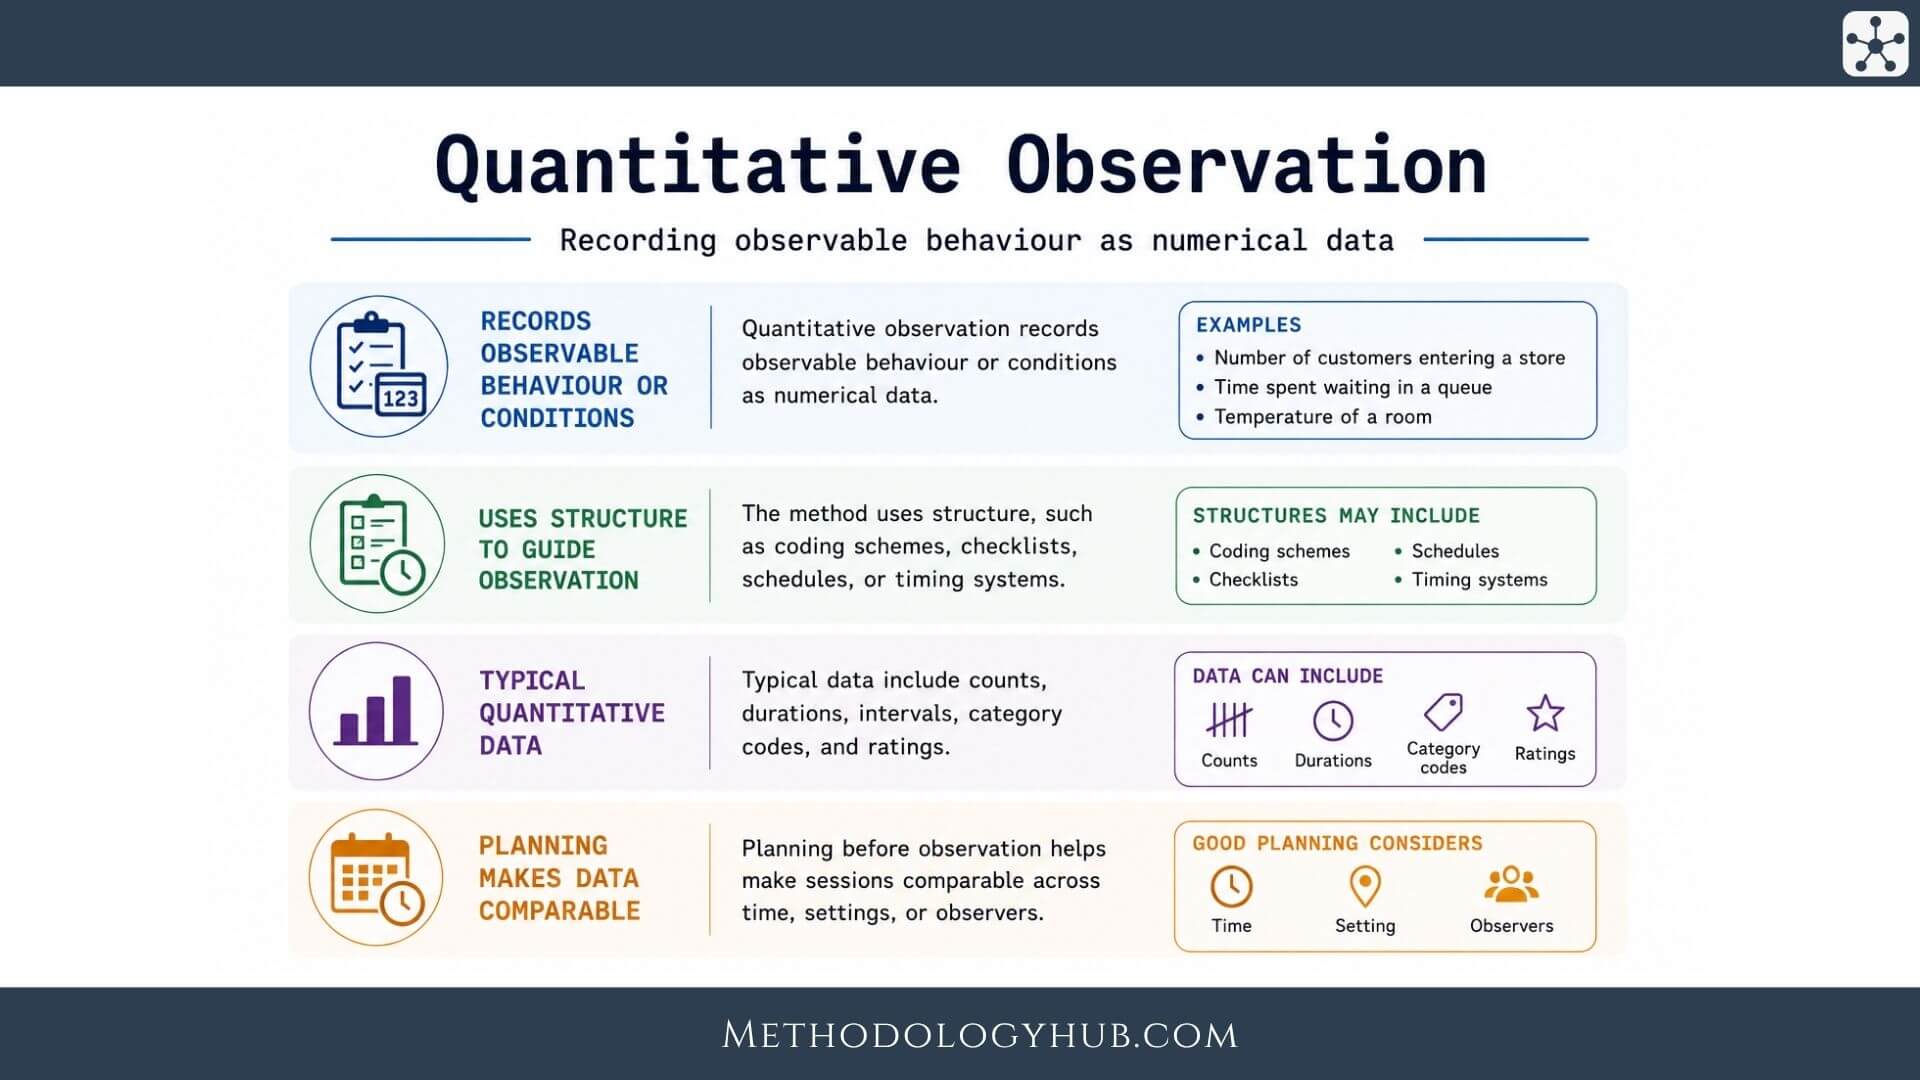
Quantitative observation is an observation method that records visible behaviour, events, actions, objects, interactions, or conditions as structured data that can be counted, compared, and analysed numerically. Instead of writing mainly descriptive field notes, the researcher defines categories in advance and records how often, how long, when, where, or under what conditions something occurs.
Researchers working in broader designs for Quantitative Research use quantitative observation when the study needs observable evidence that can be summarised through frequencies, durations, rates, percentages, scores, or comparisons between groups or settings. The method is especially useful when behaviour can be defined clearly enough for consistent recording.
Observation sits across several methodological traditions. A researcher may count how often students ask for help, how long patients wait before being called, how many pedestrians use a crossing, or how frequently staff follow a checklist. For a broader orientation to observation as a research approach, see Observational Research as the wider method family.
Quantitative Observation in Plain Terms
Quantitative observation turns observation into measurable data. The researcher watches a setting, behaviour, event, or process and records it using a structured system. The outcome is usually a data set that can be analysed with descriptive or inferential statistics.
A simple example is counting how many times a behaviour occurs during a lesson. A more complex example is recording behaviour type, time, location, participant role, and duration across several observation sessions. The researcher still observes directly, but the record is built for measurement.
Quantitative observation definition
Quantitative observation is a structured research method in which observable events, behaviours, or conditions are recorded as numerical data. The researcher usually uses a predefined coding scheme, checklist, rating scale, timing system, or observation schedule.
The method is quantitative because the observation record is designed for counting, comparison, and statistical summary. Notes may still be written, but the central data are numerical categories, scores, times, or frequencies.
How it differs from informal watching
Quantitative observation is planned before data collection begins. The researcher defines what will count as an event, how categories will be recognised, how time will be divided, and how data will be recorded. Informal watching does not have that level of structure.
This planning allows the researcher to compare observations across sessions. If each observer records the same behaviour in the same way, the data can be combined and analysed more consistently.
What the data look like
Data from quantitative observation may appear as counts, durations, rates, intervals, checklist marks, ratings, or category codes. A data table may show how many events occurred, how long they lasted, who was involved, and where they took place.
For example, an observation study of a waiting room might record arrival time, waiting duration, number of staff interactions, number of visible signs used by patients, and whether patients asked for directions.
| Observation record | Example |
|---|---|
| Frequency | Number of times a student asks a question during a session. |
| Duration | Length of time a patient waits before being called. |
| Category | Type of interaction, such as help request, instruction, correction, or peer support. |
What Can Be Observed Quantitatively?
Quantitative observation works best when the target can be defined clearly. The researcher must be able to say what counts as the event, when it begins, when it ends, and how it will be recorded.
Not every research topic can be reduced to an observable category. Feelings, intentions, meanings, and hidden reasoning cannot be directly counted unless they are connected to observable indicators. A smile, pause, raised hand, entry into a room, or completion of a task can be observed. The meaning behind it may need another method.
Behaviours and actions
Behaviours and actions are common targets for quantitative observation. These may include help-seeking, hand-raising, eye contact, tool use, walking routes, interruptions, task completion, queue movement, and compliance with a visible procedure.
The key is definition. “Participation” is too broad for a reliable observation sheet. “Speaks during group discussion” or “adds an item to the shared worksheet” is easier to record consistently.
Events and interactions
Events can be counted when they have clear boundaries. An event might be a service request, a staff greeting, a peer correction, a safety check, an interruption, a turn in conversation, or a customer entering a queue.
Interaction data can include who initiated contact, who responded, how long the interaction lasted, and what type of exchange occurred. The coding scheme must stay simple enough for observers to use in real time.
Recommendation: if two trained observers cannot recognise the same event in the same way, the category probably needs a clearer definition.
Objects, spaces, and conditions
Observation can also measure visible conditions. A researcher may record seat occupancy, sign use, room temperature category, noise level category, equipment availability, route choice, or whether a required object is present.
This can be useful in studies of classrooms, workplaces, clinics, public spaces, transport, service points, or learning environments. Visible conditions often shape behaviour, even when they are not behaviour themselves.
| Possible target | Observable version | Less suitable wording |
|---|---|---|
| Student engagement | Number of times a student contributes to group discussion. | Student seems interested. |
| Service access | Time between arrival and first staff contact. | Service feels easy to use. |
| Workplace interruption | Unplanned verbal request that stops the current task for at least ten seconds. | Work is chaotic. |
Limits of direct observation
Observation records what can be seen or heard. It cannot directly capture hidden motives, private interpretations, or internal experience. The researcher may infer cautiously from behaviour, but should not treat an observable indicator as full proof of an inner state.
This is where another method can be useful. Quantitative observation may show how often people ask for help. Interviews or open responses may explain why they do or do not ask.
Observation Schedules and Coding Categories
An observation schedule is the structured recording tool used during quantitative observation. It tells the observer what to look for, how to code it, and how to record time, events, categories, or ratings.
The schedule may be a paper form, spreadsheet, tablet form, checklist, coding grid, stopwatch sheet, or software-based record. Whatever the format, it should be clear enough to use while observation is happening.
Building categories
Categories translate the research question into observable units. If the study concerns classroom interaction, categories might include teacher question, student response, peer support, off-task talk, and task instruction. If the study concerns service use, categories might include arrival, queue entry, staff contact, form completion, and exit.
Categories should be specific and mutually understandable. Overlapping categories create confusion. If “support” and “instruction” are both codes, the schedule should explain how to choose between them.
Operational definitions
An operational definition explains exactly how a category will be recognised. It should tell observers what counts, what does not count, and how uncertain cases should be handled.
For example, “help-seeking” might be defined as a visible or audible request for assistance directed toward a teacher, peer, staff member, or support person. Looking confused would not count unless it includes a request.
Checklists, ratings, and counts
Different recording formats produce different data. A checklist records whether something was present or absent. A count records how often it occurred. A rating scale assigns a score. A timing record captures duration or order.
The choice should fit the question. If the study asks whether safety steps were followed, a checklist may be enough. If it asks how often interruptions occur, a frequency count is better. If it asks how long people wait, duration must be recorded.
| Recording format | Best use | Example output |
|---|---|---|
| Checklist | Presence or absence of visible steps | Step completed: yes or no |
| Frequency count | Number of observed events | 18 interruptions per hour |
| Duration record | Length of behaviours or waiting times | Average wait of 11.4 minutes |
Keeping the schedule usable
A schedule can fail because it is too detailed. If observers have to track many categories at the same time, data quality may drop. The schedule should be detailed enough to answer the question and simple enough to use accurately.
Piloting helps reveal whether categories are too vague, too numerous, or difficult to distinguish in real time. A short pilot can prevent a weak data set later.
Recommendation: an observer should be able to use the form while the behaviour is happening, not only after reading a transcript or memory reconstruction.
Sampling Time, Events, and Settings
Quantitative observation requires sampling decisions. The researcher must decide when to observe, where to observe, how long each session should last, which events count, and whether every event or only selected intervals will be recorded.
Sampling is important because behaviour varies by time, setting, and situation. A workplace may look different during opening hours, lunch, shift change, and closing. A classroom may differ at the beginning, middle, and end of a lesson.
Time sampling
Time sampling records behaviour during selected time periods. The researcher might observe for ten minutes every hour, the first fifteen minutes of each session, or randomly selected intervals during the day.
This approach is useful when behaviour is frequent or continuous. It can make observation manageable, but the researcher should explain why the selected times represent the wider setting.
Event sampling
Event sampling records every occurrence of a defined event. The observer may record each help request, each customer arrival, each safety check, each interruption, or each staff handover.
This works well when events are clear and not too frequent to record. If events happen very quickly or overlap, a different design may be needed.
Setting and participant sampling
The researcher also decides which settings, groups, or situations to include. A study might observe several classrooms, different service points, multiple time periods, or contrasting locations.
The sampling plan should match the comparison the study wants to make. If the aim is to compare morning and afternoon waiting times, both periods must be sampled systematically.
| Sampling choice | What it controls | Example |
|---|---|---|
| Time sampling | When observation happens | Observe ten-minute intervals across the day. |
| Event sampling | Which events are recorded | Record every help request during a session. |
| Setting sampling | Where observation happens | Observe three entrances across weekday and weekend periods. |
Recording non-events
Non-events can be data too. If no one uses a sign, no one asks for help, or no safety check occurs during a sampled interval, that absence should be recorded. Otherwise the data may only show what happened and not what failed to occur.
A clear system for recording zero counts is important. Blank spaces can be ambiguous because they may mean no event occurred, the observer forgot to record, or the data are missing.
Reliability and Accuracy in Quantitative Observation
Reliability is a major concern in quantitative observation because the data depend on consistent recording. If two observers watch the same behaviour and code it differently, the numerical data become difficult to trust.
Accuracy also depends on whether the observation schedule captures what the study claims to measure. A count may be precise without being meaningful if the category does not match the research question.
Observer training
Observers need training before data collection begins. They should learn the categories, apply operational definitions, practise on examples, and compare coding decisions. Training helps reduce inconsistent interpretation.
Practice sessions can reveal categories that sound clear on paper but are difficult to use in the field. Those categories should be revised before the main study begins.
Inter-rater reliability
Inter-rater reliability refers to the level of agreement between observers who code the same event or session. In quantitative observation, a reliability check may ask two observers to record the same session independently and then compare their records.
Disagreement can show where definitions need adjustment. If observers disagree often about “supportive interaction,” the category may need clearer examples or narrower wording.
Observer effects
People may change their behaviour when they know they are being observed. This is not unique to quantitative observation, but structured observation can make it more visible because the researcher is often present with a recording tool.
The researcher can reduce observer effects by allowing time for people to become used to the observer, using unobtrusive positioning where appropriate, and reporting how observation was conducted.
Recommendation: disagreement between observers is not only a problem. It can show which categories need clearer definitions.
Data checks during collection
Data should be checked during collection, not only at the end. The researcher can review forms for missing values, impossible times, unclear codes, blank intervals, and category drift. Early checks allow correction while the study is still active.
Category drift happens when observers slowly change how they apply a code. Regular check-ins and short reliability reviews can reduce this problem.
| Quality concern | Practical response |
|---|---|
| Unclear category | Add operational definitions, examples, and exclusion rules. |
| Observer disagreement | Run practice coding and inter-rater reliability checks. |
| Missing records | Check forms regularly and distinguish zero events from missing data. |
Quantitative, Qualitative, and Mixed Observation
Quantitative observation is not the only way to use observation in research. Some studies need numbers. Others need description, interpretation, and context. Many projects benefit from combining the two.
The choice depends on the research question. A count can show how often a behaviour occurs. A qualitative account can explain how that behaviour fits the setting, how participants understand it, and what it means in practice.
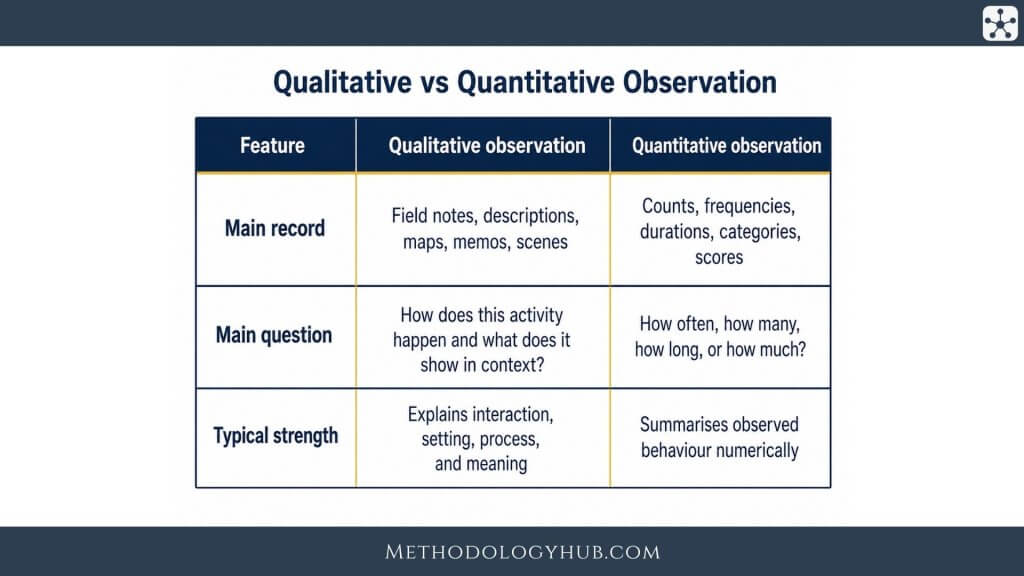
Quantitative observation compared with qualitative observation
Quantitative observation uses predefined categories and numerical records. It is strongest when the study needs measurement, comparison, or pattern detection across cases. Qualitative observation uses descriptive notes and interpretation to understand meaning, context, sequence, and experience.
When researchers need rich contextual description, Qualitative Observation may be a better fit. When they need counts, durations, and rates, quantitative observation is usually more suitable.
Using observation in mixed methods research
Observation can be combined with interviews, surveys, documents, or open responses. A study may count how often a procedure is followed, then interview staff about why some steps are skipped. Another study may measure waiting time and collect patient comments about what waiting feels like.
This combination fits many designs in Mixed Methods Research, where numerical data and qualitative explanation are used together. The observation count shows pattern, while qualitative data help interpret the pattern.
| Approach | Main record | Useful when |
|---|---|---|
| Quantitative observation | Counts, durations, categories, ratings | The study needs measurement and comparison. |
| Qualitative observation | Descriptive notes and interpretation | The study needs meaning, context, and sequence. |
| Mixed observation design | Numerical records plus qualitative explanation | The study needs both pattern and interpretation. |
Avoiding false precision
Numbers can look more certain than they are. A count of visible behaviour depends on definitions, sampling, observer position, and recording accuracy. The researcher should not report more certainty than the design supports.
For example, a study may report that help requests were recorded more often in one setting than another. The interpretation should also consider whether observers had the same visibility, whether sessions were comparable, and whether the behaviour was defined in the same way.
Recommendation: numerical observation data become stronger when the researcher explains how the numbers were produced.
Analysing Quantitative Observation Data
Analysis begins by cleaning and organising the observation records. The researcher should check missing values, impossible times, duplicate events, inconsistent codes, and unclear entries before calculating results.
The analysis may be simple or complex. Some studies only need totals, averages, percentages, or rates. Others may compare groups, settings, time periods, or conditions using statistical tests.
Descriptive analysis
Descriptive analysis summarises what was observed. The researcher may report total events, average duration, rate per hour, percentage of sessions with a behaviour, or distribution across categories.
For example, a study of classroom interaction might report the average number of teacher questions per lesson, the percentage of questions answered by students, and the distribution of peer support events across group tasks.
Comparing groups or settings
Quantitative observation often supports comparison. A study may compare morning and afternoon sessions, two room layouts, different service points, or behaviour before and after a change.
The comparison should match the sampling plan. If the observation periods were not balanced, the researcher may need to use rates rather than raw counts.
Using rates and denominators
Raw counts can be misleading when observation periods differ. Ten interruptions during a ten-minute session and ten interruptions during a one-hour session do not mean the same thing. Rates help standardise the result.
Common denominators include events per hour, behaviours per participant, actions per session, or average duration per event. The denominator should be explained clearly.
| Measure | What it reports | Example |
|---|---|---|
| Total count | Number of observed events | 42 help requests |
| Rate | Events relative to time or exposure | 6.2 help requests per hour |
| Average duration | Mean length of observed events | Average queue time of 8.7 minutes |
Reporting uncertainty and limits
Observation findings should explain how data were collected. The report should state the number of sessions, total observation time, settings, sampling method, categories, observer training, and any reliability checks.
Limitations should be clear. If observers could not see part of the room, if certain times were not sampled, or if categories changed after piloting, those details affect interpretation.
Examples of Quantitative Observation
Examples of quantitative observation show how structured observation can be adapted to different settings. In each case, the researcher defines observable categories and records data consistently.
Example 1: Classroom participation
A researcher observes group work across six lessons. The observation schedule records student questions, peer explanations, teacher prompts, off-task talk, and task completion events. Each session is divided into ten-minute intervals.
The analysis compares interaction rates across lesson stages. Findings may show that peer explanation increases after the first task instruction but declines near the end of the lesson.
Example 2: Waiting room movement
A clinic study records arrival times, queue length, first staff contact, number of direction requests, and time to appointment call. Observers also record whether patients use visible signs before asking for help.
The analysis may show peak waiting periods, average waiting duration, and whether sign use differs by entrance or time of day.
Example 3: Workplace interruptions
A workplace study defines an interruption as an unplanned request that stops the current task for at least ten seconds. Observers record interruption type, source, time, and whether the worker returns to the original task immediately.
The data can show interruption rates by shift, task type, or work area. Follow-up interviews could then explain why some interruptions are treated as helpful while others disrupt work.
Recommendation: a quantitative observation example should name the observable category, recording unit, sampling plan, and numerical output.
Example 4: Use of a public crossing
A public space study counts pedestrian use of a crossing during selected morning, afternoon, and evening intervals. Observers record route choice, waiting time, group size, and whether pedestrians cross outside the marked area.
The analysis may compare use across time periods and identify patterns that support changes to signage, crossing design, or observation questions for a later study.
Conclusion
Quantitative observation is useful when researchers need structured numerical evidence about visible behaviour, events, timing, interaction, space, or conditions. It turns observation into data that can be counted and compared.
The method works best when categories are clearly defined, observers are trained, sampling is planned, and data are checked during collection. Quantitative observation can stand alone, but it can also be combined with qualitative accounts when numbers need explanation.
FAQs on Quantitative Observation
What is quantitative observation?
Quantitative observation is a structured observation method that records observable behaviour, events, actions, interactions, or conditions as numerical data such as counts, durations, ratings, categories, or rates.
What is an example of quantitative observation?
An example is observing a classroom and recording how many times students ask questions, how often peer support occurs, and how long group activities last during each lesson interval.
How is quantitative observation different from qualitative observation?
Quantitative observation records predefined categories as numerical data for counting and comparison. Qualitative observation records descriptive detail, context, sequence, and interpretation to understand meaning and experience.
What can be measured through quantitative observation?
Quantitative observation can measure visible behaviours, events, interactions, timing, durations, route choices, object use, checklist completion, environmental conditions, and other observable indicators.
Why is reliability important in quantitative observation?
Reliability is important because observation data depend on consistent recording. Observer training, operational definitions, pilot testing, and inter-rater reliability checks help make the data more consistent.
Can quantitative observation be used in mixed methods research?
Yes. Quantitative observation can be combined with interviews, open responses, documents, or qualitative observation. The numerical observation data show patterns, while qualitative data help explain those patterns.